Comprehensive Analysis of Individual Anatomical Structures for Micturition Symptoms and Maximum Flow Rate in Men With Benign Prostatic Hyperplasia/Lower Urinary Tract Symptoms
Article information

Abstract
Purpose
Individual anatomical structural variations, including intravesical prostatic protrusion (IPP), prostatic urethral angle (PUA), prostatic urethral length, or prostatic apex shape, were correlated with micturition symptoms. We aimed to investigate the effects of these variables on micturition symptoms in men with benign prostatic hyperplasia (BPH)/lower urinary tract symptoms (LUTS).
Methods
This observational study was based on data from 263 men with the first visit to health promotion center and without BPH/LUTS treatment between March 2020 and September 2022. A multivariate analysis was performed to determine the variables affecting total international prostate symptom score, maximum flow rate (Qmax), and voiding efficacy (postvoid residual volume to total bladder volume ratio).
Results
Of 263 patients, decreasing PUA increases the severity of international prostate symptoms score (mild, 141.9°; moderate, 136.0°; severe, 131.2°; P<0.015). A multivariate analysis reported that the total international prostate symptom score was correlated with age (P=0.002), PUA (P=0.007), and Qmax (P=0.008). Qmax was negatively associated with IPP (P=0.002). In subanalysis for large prostate volume (≥30 mL, n=81), international prostate symptom score was correlated with PUA (P=0.013), Qmax was correlated with prostatic apex shape (P=0.017), and length of proximal prostatic urethra (P=0.007). IPP was not identified as a significant factor. For small prostate volume (<30 mL, n=182), age (P=0.011) and prostate volume (P=0.004) are correlated with increasing Qmax.
Conclusions
This study presented that individual anatomical structure variations influenced the micturition symptoms according to prostate volume. To identify the major resistant factors in men with BPH/LUTS, further studies are required to investigate which components played a role in major resistant factors for micturition symptoms.
INTRODUCTION
As society ages, diseases threatening life and impacting the quality of life (QoL) are becoming increasingly significant. Benign prostatic hyperplasia (BPH)/lower urinary tract symptoms (LUTS) significantly affect the QoL and tend to worsen with age. In the past, benign prostatic enlargement was considered a major cause of BPH/LUTS. However, some studies and clinical experiences of urologists have found no correlation between prostate volume and micturition symptoms [1-4]. Guidelines suggest using symptom questionnaires such as International Prostatic Symptom Score (IPSS), urinalysis, prostate-specific antigen (PSA), uroflowmetry-derived parameters, and prostate volume to assess micturition symptoms. They also recommend additional assessments such as cystoscopy or urodynamic study. Despite this, many patients still report severe micturition symptoms that do not align with test results.
The pressure flow study is the verified tool for evaluating micturition function and bladder outlet obstruction (BOO) in men. Flow-rate measurements and detrusor pressure are the most reliable parameters [5]. However, it is difficult to perform for all patients due to the invasiveness of the study and possible adverse events. As various knowledge and experiences affecting LUTS are accumulated, and fluid dynamic concerns continue, studies on the anatomical structural predictors of the prostate and prostatic urethra are ongoing. Intravesical prostatic protrusion (IPP) [6-9] was first reported as a factor affecting LUTS, and prostatic urethral angle (PUA) [10-13], prostatic urethral length (PUL) [14,15] and prostate apex shape (PAS) [4,16] were also reported as predictors of LUTS and treatment outcomes.
The correlation between individual anatomical structures and the severity of micturition symptoms, medical treatment, procedure, or surgical treatment outcomes have been studied in various ways. However, no study comprehensively analyzed anatomical structural predictors such as IPP, PUA, PUL, and PAS. Since micturition symptoms are affected by multifactorial causes, this study was planned because of the need for a comprehensive study of individual anatomical structures.
MATERIALS AND METHODS
Data Collection
This observational study was based on data from our health promotion center database of men who received their first transrectal ultrasound (TRUS) between March 2020 and September 2022. Of these patients, 436 were excluded based on a detailed medical history evaluation. The exclusion criteria were (1) patients with prior medical treatment for LUTS (n=195) and transurethral surgery (n=6); (2) those with incomplete questionnaires for IPSS (n=28) or unmeasurable TRUS parameters (n=132) due to severe calcification or huge prostate volume; (3) patients have pyuria on urine analysis (n=26) or had uncontrolled diabetes mellitus (n=3) or neurologic disease (n=6) that could affect micturition function; and (4) patients with or suspected urologic tumors such as a bladder tumor (n=4), renal mass (n=1), serum PSA elevation (n=24), and diagnosis of prostate cancer (n=11). Finally, 263 patients were included in this study. Data on the following variables were collected: age, prostate volume, serum PSA, IPSS, TRUS findings, uroflowmetry-derived parameters including maximum flow rate (Qmax), voided volume, and postvoid residual urine volume (PVR).
Definitions and TRUS Parameters
The status of patients’ micturition symptoms was stratified using the IPSS questionnaire (mild, 1–7 points; moderate, 8–19 points; and severe, 20–35 points) [17-19]. IPSS data were subdivided into voiding and storage symptom scores [20]. Total bladder volume (TV) was defined as voided urine volume plus PVR. We evaluated voiding efficacy using the PVR to TV ratio. TRUS parameters were measured by 1 urologist with more than 10 years of experience, in the same way, in real-time, for all patients at the health promotion center, using the BK3000 ultrasound system (BK Medical, Peabody, MA, USA). The parameters measured were IPP, PUA, length of the proximal prostatic urethra, length of the distal prostatic urethra, and PAS. Prostate volume was calculated using the prostate ellipsoid formula (height×width×length×π/6) [21,22]. IPP has defined the vertical distance from the tip of IPP to the base of the bladder neck in the parasagittal plane of TRUS [6,12]. IPP data were classified into 3 grade according to previous studies (5 mm or less, 5 to 10 mm, and greater than 10 mm) [6,23]. The PUA was defined as the larger angle consisting of 2 planes of the proximal and distal prostatic urethra on the parasagittal plane of TRUS, which was taken with minimal pressure from the transrectal probe to prevent PUA deformity (Fig. 1). The proximal prostatic urethra was defined as the length of bladder neck including IPP to the inflection point of the prostatic urethra and the distal prostatic urethra was defined length of the inflection point of the prostatic urethra to the apex as Fig. 1. PAS were categorized into 4 different groups on the parasagittal plane of TRUS, using the following criteria that were previously reported by Myers [24]: (1) apex overlapping membranous urethra both anteriorly and posteriorly, (2) apex overlapping membranous urethra anteriorly, (3) apex overlapping membranous urethra posteriorly, and (4) no overlapping observed between the apex and membranous urethra (Fig. 2). PUL and PAS were measured based on the image which were measured PUA with minimal pressure on the transrectal probe.
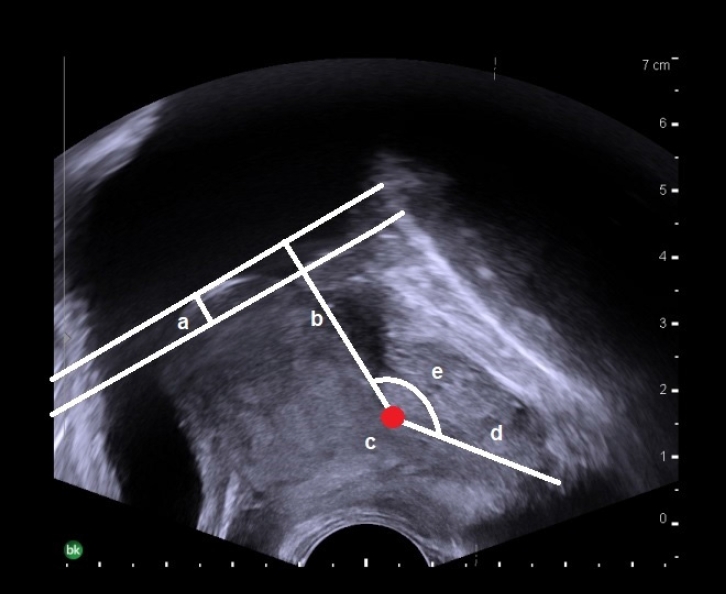
Transrectal ultrasonographic measurements of prostatic urethral length (a+b+d), intravesical prostatic protrusion (a), the base of the bladder neck to inflection point of prostatic urethra (b), inflection point of prostatic urethral (c), proximal prostatic urethra (a+b), distal prostatic urethra (d), and prostatic urethral angle (e) in a parasagittal image.
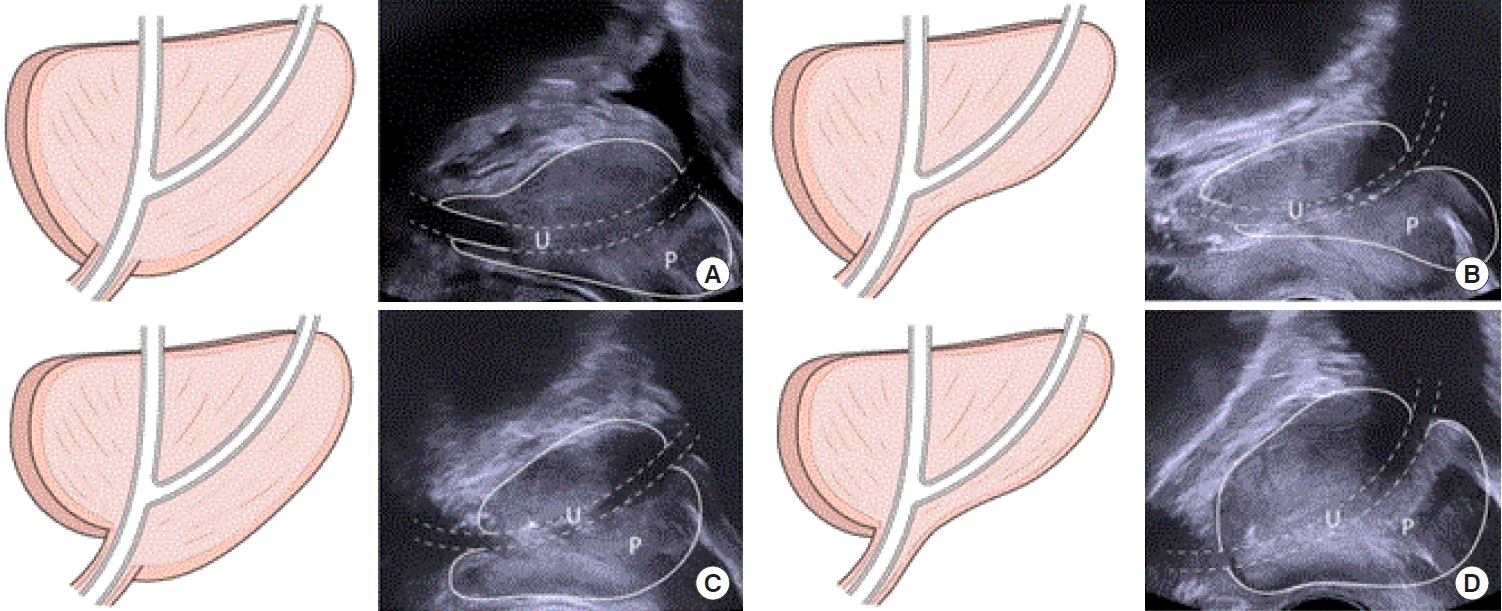
Prostatic apex shape categorized into 4 different groups on parasagittal plane of transrectal ultrasound. (A) Apex overlapping membranous urethra both anteriorly and posteriorly. (B) Apex overlapping membranous urethra anteriorly. (C) Apex overlapping membranous urethra posteriorly. (D) No overlapping observed between the apex and membranous urethra. P, prostate; U, prostatic urethra.
Statistical Analyses
All values are expressed as number (%) or mean±standard deviation. Continuous variables are expressed as medians (interquartile range). Between patient groups, the parameters were compared using Student t-test for continuous variables and the chisquare test (Fisher exact test) for 2 or more variables. Univariate and multivariate linear regression analyses were performed to identify independent predictors associated with the severity of IPSS, Qmax, and PVR to TV ratio. All reported P-values were two-sided, and a P-value of <0.05 was considered to indicate statistical significance. All statistical tests were conducted using IBM SPSS Statistics ver. 25.0 (IBM Co., Armonk, NY, USA).
RESULTS
Baseline Characteristics
The baseline characteristics of patients according to the severity of total IPSS who first visited the health promotion center are presented in Tables 1 and 2. When divided into mild, moderate, and severe groups according to the severity of IPSS (Table 1), IPSS was 5.8±1.9, 14.4±2.9, and 23.4±22.0 and PUA was decreasing (141.9°, 136.0°, 131.2°, P<0.015) respectively. Each IPSS was divided into voiding symptom score and storage symptom score; there were also differences between the 3 groups in both types of scores. There was a difference in the QoL score (P=0.045) according to the severity of IPSS, but there were no differences in age, prostate volume, IPP, PAS, Qmax, VV, and PVR. When divided based on the prostate volume≥30 mL, age (P=0.024), PSA (P<0.001), QoL score (P=0.010), IPP (P=0.005), length of proximal prostatic urethra (P<0.001), length of distal prostatic urethra (P<0.001), PVR (P=0.035) were significantly different (Table 2).
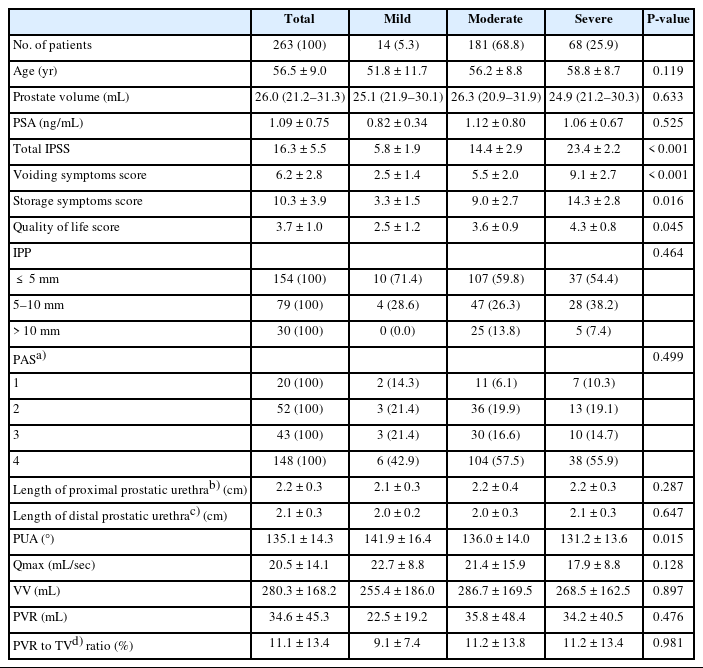
Baseline characteristics of the patients according to the severity of IPSS who first visit health promotion center
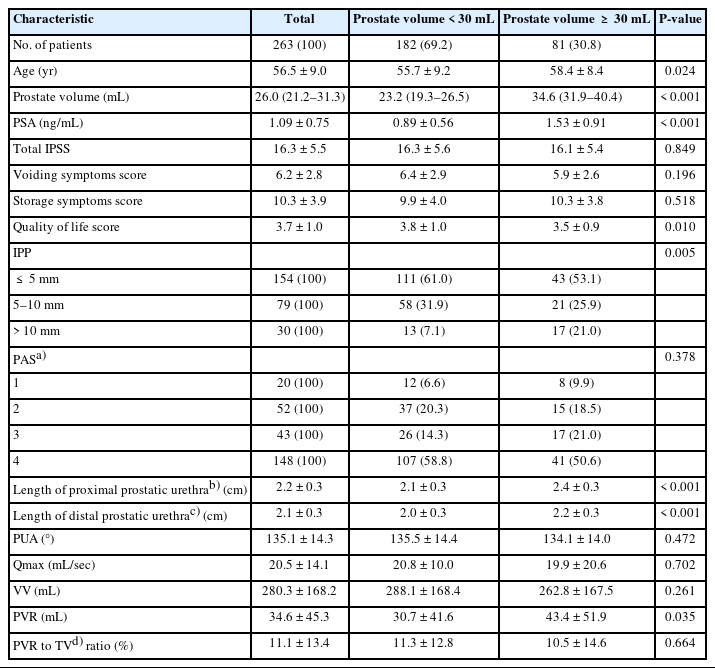
Baseline characteristics of the patients according to prostate volume who first visit health promotion center
Association of Predictors for Total IPSS
In linear regression analysis, age (β=0.12; 95% confidence interval [CI], -0.042 to -0.190; P=0.002), PUA (β=-0.07; 95% CI, -0.111 to -0.018; P=0.007) and Qmax (β=2.30; 95% CI, 0.736– 5.328; P=0.008) were significantly associated with total IPSS (Table 3). In the subgroup analysis by dividing the prostate volume ≥30 mL, age (β=0.15; 95% CI, 0.025–0.269; P=0.019) and Qmax (β=-0.12; 95% CI, -0.222 to -0.017; P=0.023) showed significant correlations in univariate analysis in small prostate but were not statistically significant in multivariate analysis. In the large prostate, only PUA (β=-0.19; 95% CI, -0.342 to -0.044; P=0.013) showed a significant relationship with total IPSS.
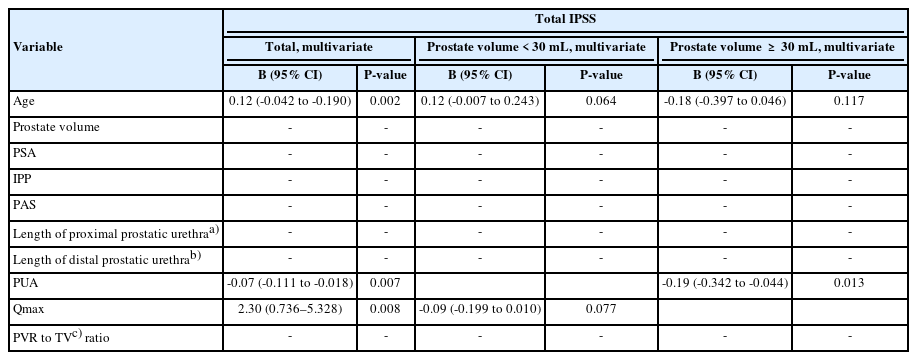
Association of predictors for total IPSS according to prostate volume
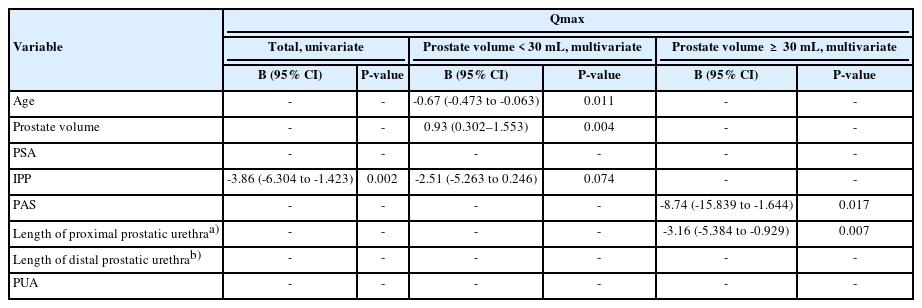
Association of Predictors for Qmax
In linear regression analysis, IPP (β=-3.86; 95% CI, -6.304 to -1.423; P=0.002) was significantly associated with Qmax (Table 4). In the subgroup analysis by dividing the prostate volume ≥30 mL, age (β=-0.67; 95% CI, -0.473 to -0.063; P=0.011) and prostate volume (β=0.93; 95% CI, 0.302–1.553; P=0.004) showed significant correlations in small prostate and PAS (β=-8.74; 95% CI, -15.839 to -1.644; P=0.017) and length of proximal prostatic urethra (β=-3.16; 95% CI, -5.384 to -0.929; P=0.007) showed significant correlations in large prostate.
Association of predictors for Qmax according to prostate volume
Association of Anatomical Structural Predictors for Voiding
Symptoms Scores and Storage Symptom Scores Table 5 presents the relationship between anatomical structural variables and prostate volume when the IPSS was divided into voiding and storage symptom scores. PUA was significantly associated with the voiding symptom score (β=-0.12; 95% CI, -0.054 to -0.002, P=0.027), and this association was also found for prostate size ≥30 cm3 (β=-0.19; 95% CI, -0.169 to -0.008; P=0.047).

Association of anatomical structural predictors for v-IPSS and s-IPSS according to prostate volume
DISCUSSION
We evaluated correlations between individual anatomical structures and total IPSS, Qmax, and voiding efficacy, and performed subanalysis according to prostate volume. In patients with a relatively large prostate, PUA was a predictor affecting the total IPSS. Predictors affecting Qmax were IPP, but PUL was a more affecting factor in patients with a larger prostate. In patients with a relatively small prostate, the length of the proximal prostatic urethra was a predictor of voiding efficacy.
IPP, PUA, PUL, and PAS have been reported as anatomical structures that exacerbate BOO or BPH/LUTS. IPP is a phenomenon in which prostatic adenoma grows into the less resistant space inside the bladder and is known to cause BOO and exacerbate BPH/LUTS [7]. PUA is an angle of about 145° proximal to the verumontanum as the prostatic urethra passes through the prostate from base to apex [13]. This angle may decrease as the prostatic adenoma grows, resulting in bladder neck high riding, but it can also decrease in men without adenoma grown [13]. PUL is the sum of the lengths of the proximal and distal prostatic urethra and is affected by prostate volume and PUA [25]. The most recently suggested structure is PAS. Since Myer [24] reported 4 types of PAS separately, there have been several studies on urinary continence or surgical margin after radical prostatectomy, but studies in BPH/LUTS are lacking .
Many studies suggest IPP or PUA is the factor causing BOO, and prior research has shown a connection between total IPSS and Qmax [6-8,10]. Park et al. [12] reported an association between IPSS and IPP, PUA. This study measured PUA on the smaller angle between 2 layers of the proximal prostatic urethra and the distal prostatic urethra but was semantically consistent with our results. However, the correlation between IPP and total IPSS was not clear in our study, which may be because the patients in our study were relatively younger and had less severe micturition symptoms. Although Qmax was not separately analyzed in the study by by Park et al. [12], it was analyzed in the study of Boulma et al. [26], that IPP affects lower Qmax (r=-0.61, P<0.01). Wang et al. [27] also reported a negative correlation between IPP and Qmax (r=-0.30, P<0.001). Our results for IPP and PUA are similar to those of previous studies
Few studies have been reported on PUL and PAS in BOO or BPH/LUTS. Yaris and Oztekin [15] reported the relationship between lower detrusor muscle pressures at Qmax, higher BOO index, and longer PUL. In this study, the patients were about 10 years older (66.2 years), and had higher total IPSS (23.3), had larger prostates (54.2 mL) compared to patients included in our study. Our study did not include a urodynamic study, making comparisons difficult. However, considering the results of our study in which PUL appears to be a significant factor for a relatively large prostate group, we expect similar results under similar conditions. Ko et al. [25] analyzed correlations between factors, including PUL, PUL to prostate volume ratio, and IPSS. Interestingly, PUL to prostate volume ratio was the only factor related to IPSS, but PUA was not related. In our study, the analysis of the PUL to prostate volume ratio was not included, so we do not know, but the PUA was a significant predictor of total IPSS (P=0.007). According to a subanalysis by Ko et al. [25], which divided 4 groups by mean cutoffs for PUL (62 mm) and prostate volume (30 mL), longer PUL with smaller prostate volume group had significantly higher IPSS scores than shorter PUL with larger prostate volume (P=0.042). This implication may mean that the effects of PULs were not proven in this study, but further research may be needed. Our previous study was the only report on PAS in BPH/LUTS field [4]. Unlike our previous study that PAS was related to IPSS and Qmax, this study showed an association with Qmax only in the large prostate. A more extensive multicenter study is needed to clarify the correlation between PAS and BPH/LUTS.
In our study, no differences in uroflowmetry-derived parameters were identified between the groups, according to IPSS. This may be because the symptom questionnaire may be very subjective since it relies heavily on the patient’s memory of their condition. Setthawong et al. [28] reported no correlation between IPSS and uroflowmetry-derived parameters. Several studies have also reported no correlation between the results of urodynamic studies and symptom questionnaires [2,3]. This also highlights the need for studies on various factors, including anatomical structural variations that affect subjective symptoms.
Our study was one of the few studies comprehensively analyzing the relationship between various individual anatomical structures and total IPSS, Qmax. A subgroup analysis was performed according to prostate volume. Our study has some limitations. First, as a retrospective single-center study, there was selection bias since the factors that cause voiding symptoms are multifactorial. Second, patients with neurological disease or uncontrolled diabetes mellitus were excluded, but there was no data on bladder function because a urodynamic study was not performed. Third, the analyses were limited to anatomical structures, and other variables may not be considered. For example, urethral elasticity or the shape of IPP could be other important variables, but there was insufficient evidence to quantify or define them. In the future, a larger multi-institutional study is needed, and it is also necessary to consider creating a model that evaluates by giving appropriate weights to various variables.
In an aging society, BPH/LUTS is a significant concern for men’s QoL. Various factors trigger it, including individual anatomical structural predictors such as IPP, PUA, PUL, and PAS. Our study is one of the few studies that comprehensively reported the relationship between these anatomical structures and BPH/LUTS. To identify the major resistant factors in men with BPH/LUTS, further studies were required to investigate which components played a role in major resistant factors for micturition functions.
Notes
Research Ethics
This study was approved by the Institutional Review Board of Yonsei University Health System (2021-0106-001), and all procedures were conducted in accordance with the ethical standards of the 1964 Helsinki declaration and its later amendments. The requirement for informed consent was waived for this study as it was based on retrospective, anonymous patient data and did not involve patient intervention or human tissue samples.
Conflict of Interest
No potential conflict of interest relevant to this article was reported.
AUTHOR CONTRIBUTION STATEMENT
• Conceptualization: DHK, KSL, JWY
• Data curation: DHK, KSL, KCK, BHC, JWY
• Formal analysis: DHK, KSL, JWY
• Funding acquisition: KSL, JWY
• Methodology: DHK, JWY
• Project administration: DHK, JWY
• Visualization: JWY
• Writing - original draft: DHK
• Writing - review & editing: JWY