


• HIGHLIGHTS
- Expression analysis revealed 16 upregulated and 4 downregulated genes in STZ-DM bladder samples.
- These miRNAs may provide useful targets for diagnosis and treatment in diabetic cystopathy.
INTRODUCTION
Diabetes mellitus (DM) is a chronic pathology with numerous contributing factors. Within the United States, approximately 18 million people have been diagnosed with DM, which is considered to be an epidemic. Globally, DM impacts almost 150 million individuals [1-5]. Consequences of DM encompass pathological alterations in nervous, metabolic and hormonal systems and blood vessels, which can lead to various complications than can affect numerous viscera. Changes in the retina, nerves and heart are the most well-recognized one. Men with DM ultimately suffer from bladder issues [6-11].
Streptozotocin (STZ)-DM rat is murine model that mimics numerous facets of urinary tract manifestations of diabetes. In both humans with DM and STZ-DM rodent model, slowly advancing bladder impairment is seen. Its progression is thought to rely on longevity and gravity of DM. Nevertheless, bladder issues seen in DM can form a complicated syndrome with a number of underlying factors. The exact molecular pathways related to the way in which raised serum glucose levels impact the bladder have yet to be elucidated.
The key nature of gene expression alterations that occur in hypertrophic remodeling related to bladder obstruction and additional urinary tract issues seen in diabetes has been appreciated for some time [12]. Although a range of molecular modifications have been identified, analyses of gene expressions pertaining to specific pathways that impact bladder complications in animal models of diabetes have yet to be conducted. Thus, next generation sequencing experiments were performed using samples of bladder tissues from male STZ-DM rats. Analyses were conducted at 12 weeks after metabolic features of diabetes were verified.
Gene modifications were classified into those affecting smooth muscle, neurotransmitter, nerve, urothelium proliferation, receptor expression, apoptosis, neurodegeneration, calcium ion channel, muscarinic M2 and M3 receptors, myosin light chain phosphatase and prostaglandin.
The presence of STZ-DM for a time interval greater than 8 weeks is associated with notable and repeatable changes in bladder activity [13-16]. The aim of the current research was to determine expression changes of mRNAs provoked by DM and pertain to particular viscera. These findings can be utilized as de novo and enhanced targets for designing treatments that might mitigate disabling symptoms of bladder impairment associated with DM.
MATERIALS AND METHODS
Animals and Induction of Diabetes
All experimental protocols were performed in accordance with the National Institute of Health Guide for the Care and Use of Laboratory Animals. They were sanctioned by the facility’s Institutional Animal Care and Use Committee.
Eight male Sprague-Dawley rates weighing approximately 200 g were utilized for this study. They were housed in surroundings kept at a constant room temperature with a 12 hourly diurnal cycle in place. They had free access to food and water.
Rodents were placed into their own cages. To provoke DM, 60-mg/kg STZ (Sigma, St. Louis, MO, USA) in /kg sterile citrate buffer was administered by intraperitoneal injection. A comparable quantity of citrate buffer alone was delivered to control rats. A tail stick and Accu-Check glucose monitor (Roche Diagnostics, Basel, Basel-Stadt, Switzerland) were used to facilitate measurement of serum glucose at 24 hours after STZ administration. Hyperglycaemia > 300 mg/dL was deemed to be an indication of DM. Each rat’s body mass and serum glucose titers were evaluated at weekly intervals over the 12-week duration of the experiment. Twelve weeks after diagnosis of diabetes, rats were sacrificed in a carbon dioxide asphyxiation chamber and the bladder was surgically extracted from each rat. Bladder tissues were rapidly frozen using liquid nitrogen. After long diabetic induction period of 12 weeks, control #1 and diabetic #3 died, so we analyzed the remaining 3 rats in each group. They were then kept at a temperature of -70آ°C prior to RNA processing. The Animal Institute Committee sanctioned all procedures conducted during the study. The above methods yielded 3 control and three 12-week STZ-DM bladders, respectively, that were age-matched.
RNA Isolation
Total RNA was isolated from bladder tissue using Trizol reagent (Invitrogen, Carlsbad, CA, USA). RNA quality was assessed with an Agilent 2100 bioanalyzer using an RNA 6000 Nano Chip (Agilent Technologies, Amstelveen, The Netherlands). RNA quantification was performed using a ND-2000 Spectrophotometer (Thermo Fisher Scientific, Wilminton, DE, USA).
Library Preparation and Sequencing
The construction of library was performed using a QuantSeq 3’mRNA-Seq Library Prep Kit (Lexogen GmbH, Wien, Austria) according to the manufacturer’s instructions. In brief, each 500 ng total RNA was prepared and an oligo-dT primer containing an Illumina-compatible sequence at its 5’end was hybridized to the RNA. Reverse transcription was then performed. After degradation of RNA template, second strand synthesis was initiated with a random primer containing an Illumina-compatible linker sequence at its 5’end. Double-stranded library was purified using magnetic beads to remove all reaction components. The library was amplified to add complete adapter sequences required for cluster generation. The finished library was purified from polymerase chain reaction components. High-throughput sequencing was then performed as single-end 75 sequencing using a NextSeq 500 (Illumina, Inc., San Diego, CA, USA).
Data Analysis
For quality control of sequences, those with quality under Q20 were removed during the trimming process using BBDuk (U.S. Department of Energy Joint Genome Institute, https://jgi.doe.gov). Sequence reads were aligned using Bowtie2 [17]. Bowtie2 indices were either generated from genome assembly sequence or representative transcript sequences for aligning to the genome and transcriptome. The alignment file was used for assembling transcripts, estimating their abundances and detecting differential expression of genes. Differentially expressed gene (DEG) were determined based on counts from unique and multiple alignments using coverage in Bedtools [18] and UCSC database (University of California Santa Cruz Genomics Institute, http://genome.ucsc.edu). Read count data were processed based on quantile normalization method using EdgeR within R (R development Core Team, 2016) using Bioconductor [19]. Gene classification was based on searches done using DAVID (http://david.abcc.ncifcrf.gov/) and MEDLINE databases (http://www.ncbi.nlm.nih.gov/). DEGs with statistical significance were identified.
A limma test within R was conducted to perform differential gene analysis in order to recognize genes that exhibited notable dysregulation. Dysregulation and significant variations between the 2 cohorts were identified when DEGs were altered by a fold change of ≥ 1.5 with a false discovery rate P < 0.05. Identified DEGs were then recognized with a hierarchical clustering/heat map and volcano plot filtering of the 2 cohorts (Supplementary Table 1, Supplementary Fig. 1).
Gene Ontology (GO) (www.geneontology.org) and Kyoto Encyclopedia of Genes and Genomes (KEGG) enrichment analyses were performed to annotate potential functions of DEGs. Differential gene analysis was carried out to identify significantly dysregulated genes based on the following criteria: P < 0.05 and 1.5-fold change. These genes were then subjected to GO function and pathway (KEGG) enrichment analysis by Fisher exact test.
To reveal potential association of DEGs, Cytoscape-STRING Gene network analysis software was used according to normalized signal intensity of individual genes. In these representations, each gene corresponded to a node and the color of nodes represented upregulated or downregulated expression of a specific gene.
RESULTS
Glucose Levels in Diabetic Rats
Rodents with SZT-induced diabetes exhibited a lighter body mass (219.3 آ± 14.7 g) at 12 weeks compared to controls (404 آ± 25.5 g, P < 0.05). The mass of the bladder at this juncture was equivalent in SZT-treated and control rodents (3.0 آ± 0.2 g and 2.75 آ± 0.1 g, respectively, P > 0.05). The diabetic cohort had a greater residual urine volume (4.0 آ± 0.4 mL) than their control counterparts (0.7 آ± 0.2 mL, P < 0.05) at 12 weeks. Ten weeks after SZT treatment, rodents with DM were markedly hyperglycaemic (492 آ± 44 mg/dL) compared to the controls (106 آ± 2 mg/dL, P < 0.05). A glycaemic level of ≥ 300 mg/dL was sustained for the duration of the experiment.
Expressed mRNAs in Bladders
Differentially expressed mRNAs in bladders from STZ-DM rodents
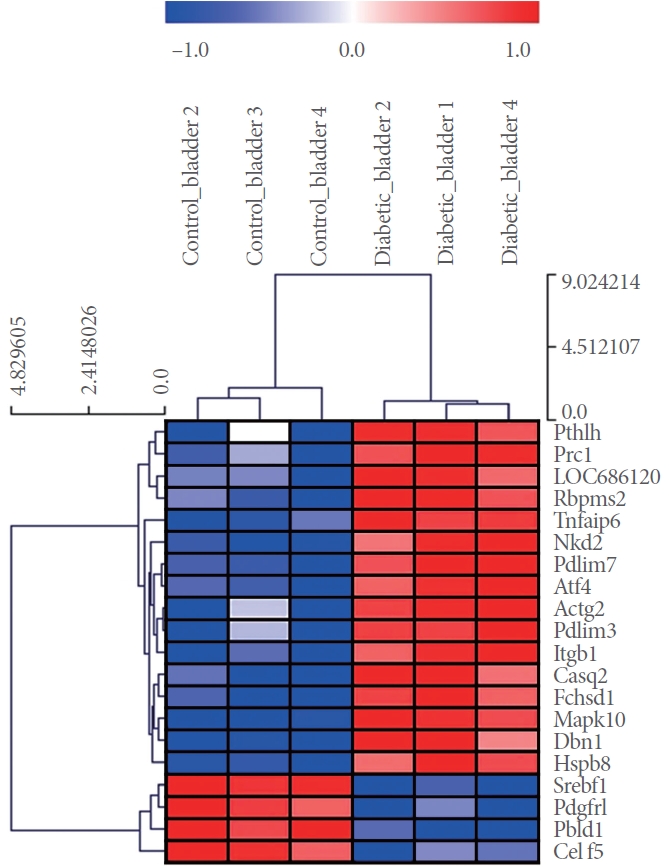
RNA-seq was used to detect DEGs in bladders of STZ-DM rodents. DEGs in the STZ-DM bladder samples were recognized by expression analysis according to the criteria detailed above. A total of 16 upregulated and 4 downregulated genes in the STZ-DM bladder samples were identified by expression analysis, encompassing PTHLH (fold change 6.2x), TNFAIP6 (6.1x), PRC1 (5.8x), MAPK10 (5.1x), LOC686120 (4.3x), CASQ2 (3.8x), ACTG2 (2.6x), PDLIM3 (2.3x), FCHSD1 (2.0x), DBN1 (2.0x), NKD2 (1.9x), PDLIM7 (1.8x), ATF4 (1.7x), RBPMS2 (1.7x), ITGB1 (1.6x), HSPB8 (1.6x), SREBLF1 (-1.6x), PBGFR1 (-1.7x), PBLD1 (-2.9x), and CELF1 (-4.4x).
Hierarchical cluster analysis and volcano plot
Within bladders from STZ-DM rats, various deregulated mRNA footprints compared to the control group were recognized during hierarchical clustering analysis (Fig. 1).
Functional Annotation Analysis
GO/biological process associated with alterations of mRNA expression in STZ-DM bladders
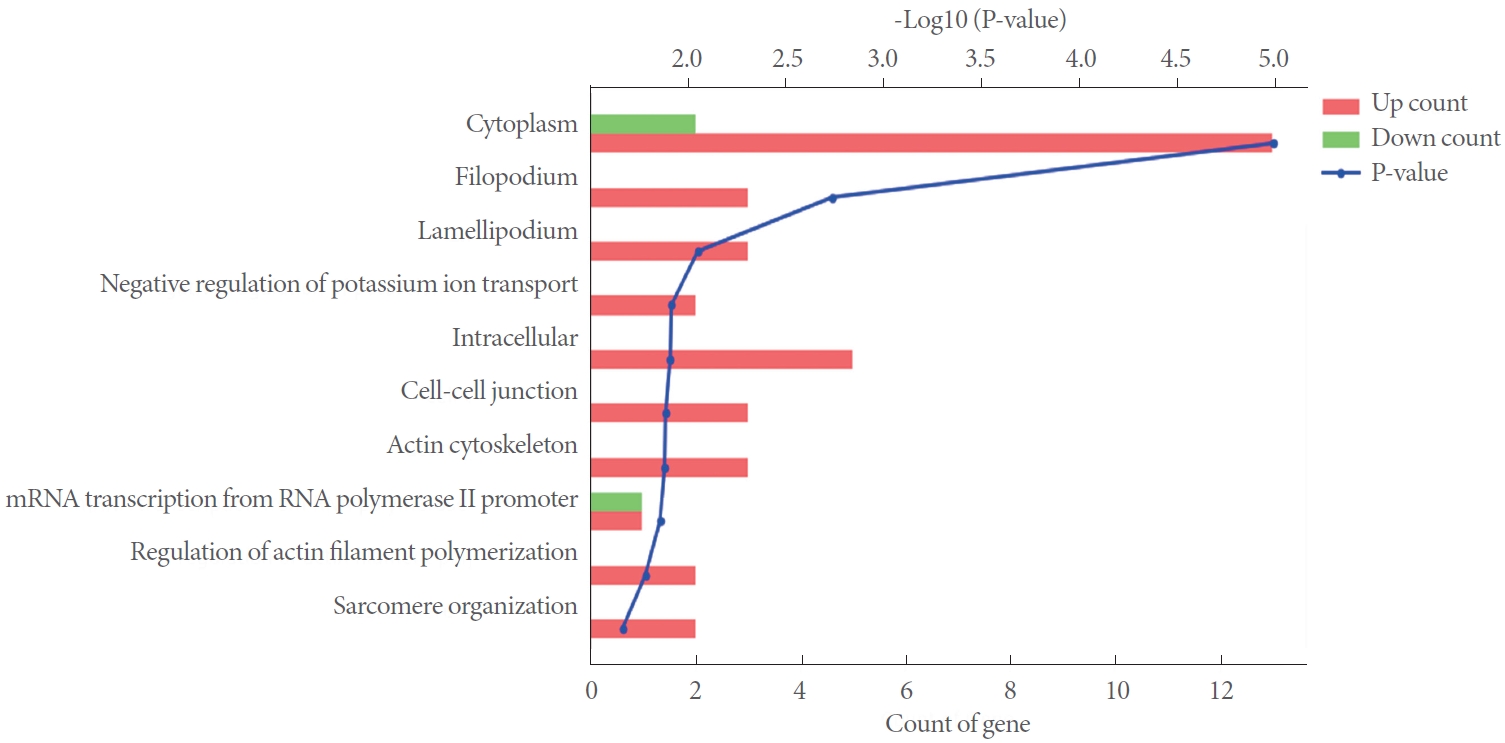
Fig. 2 illustrates GO analysis results, the frequency of â€کhits’ for each biological process and P-value. With respect to the 16 upregulated genes, the following key biological process emerged: cytoplasm, filopodium, lamellipodium, negative regulation of potassium ion transport, intracellular, cell-cell junction, actin cytoskeleton, mRNA transcription from RNA polymerase II promoter, regulation of actin filament polymerization and sarcomere organization (Fig. 2).
Core genetic biological process that arose from the 4 downregulated genes following GO analysis encompassed cytoplasm and mRNA transcription from RNA polymerase II promoter (Fig. 2).
Biological processes related to upregulated genes were associated with genes anticipated to participate in changes in potassium transport, actin cytoskeleton, actin filament and sarcomere within the nerve and detrusor muscles. In contrast, those related to downregulated genes were implicated in the cytoplasm and mRNA transcription underlying bladder impairment.
KEGG pathway showing impact of STZ-DM on transcription in the bladder
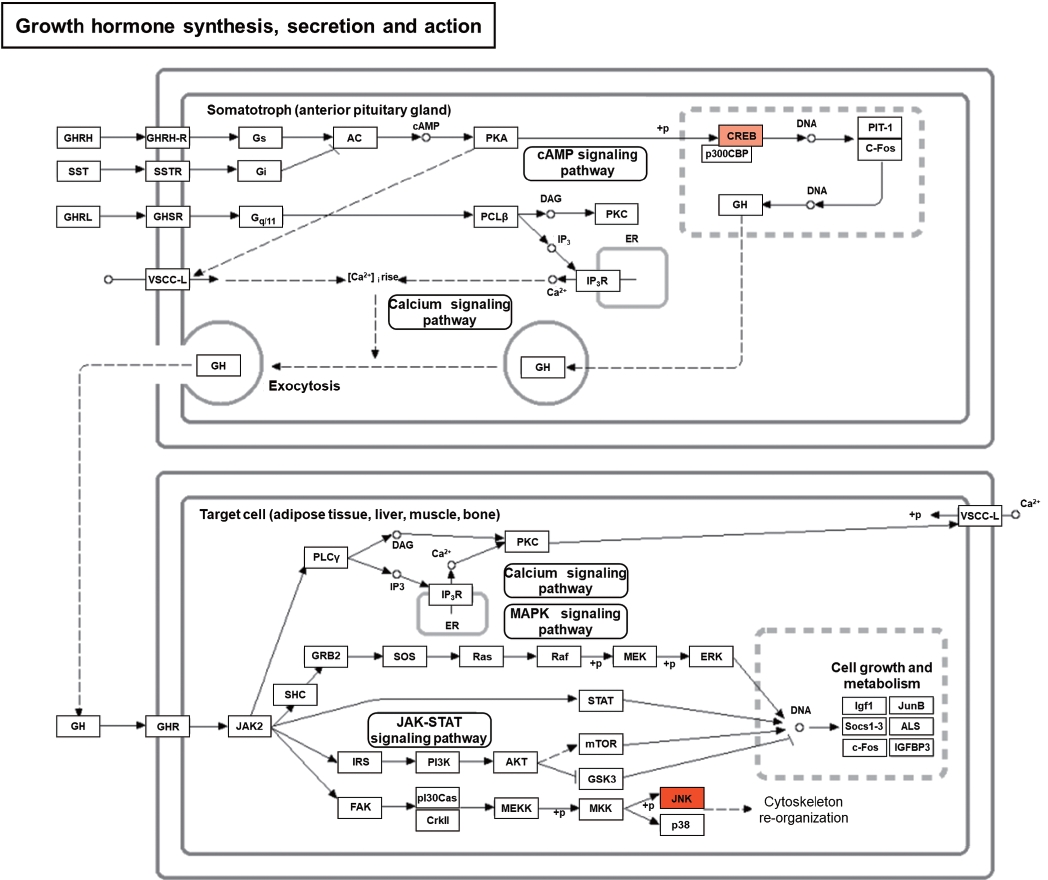
In order to demonstrate possible impact of STZ-DM provoked changes in mRNA expression on bladder activity in more details, a number of data sets were generated and submitted for KEGG enrichment analysis, which recognized the contribution of several comparable signaling pathways. In the case of gene upregulation, these encompassed growth hormone synthesis, secretion and action, lipid and atherosclerosis, non-alcoholic fatty liver disease, toxoplasmosis and yersinia infection (Fig. 3).
Protein-Protein Interaction Analysis
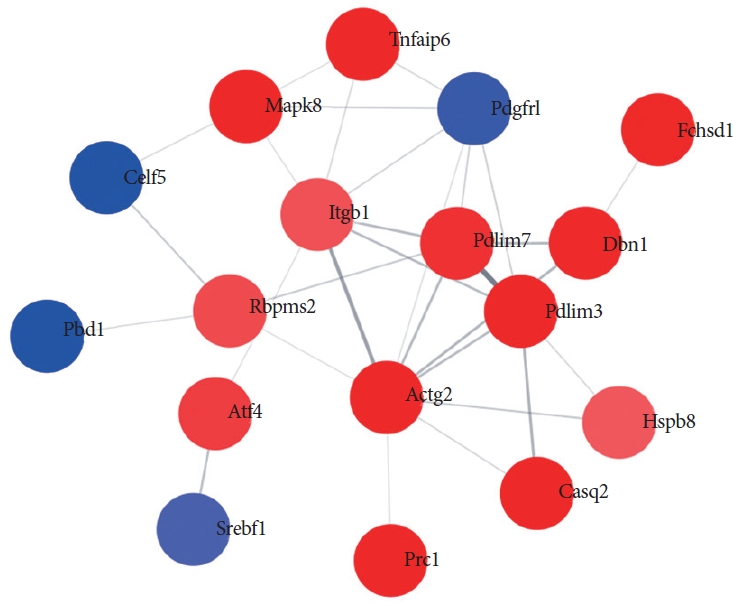
According to the Method section, the Protein-Protein Interaction network with a total of 17 nodes and 31 relationship pairs was obtained. Core nodes with the greatest possible frequency within the network included PDLIM3, PDLIM7, ITGB1, ACTG2, CASQ2, and DBN1 which were co-expressed positively with their anticipated targets (Fig. 4).
DISCUSSION
The current work found that expression levels of PTHLH, TNFAIP6, PRC1, MAPK10, LOC686120, CASQ2, ACTG2, PDLIM3, FCHSD1, DBN1, NKD2, PDLIM7, ATF4, RBPMS2, ITGB1, and HSPB8 were significantly increased in STZ-induced diabetic bladder. Actin participates in muscle contraction. PDLIM3 (PDZ and LIM domain protein 3) and PDLIM7 are actin associated proteins that can bind to actin filament of smooth muscles. They might be involved in diabetic contractile bladder dysfunction [20]. ACTG2 is actin gamma 2 protein of smooth muscles. Alpha actin is a major component of smooth muscles. Gamma 2 actins coexist with alpha actin as components of muscle tissues and mediators for muscle contraction [21]. They can be involved in diabetic contractile bladder dysfunction. ITGB1 (integrin خ²1) is a cell surface receptor that links the actin cytoskeleton with the extracellular matrix. It is associated with integrin خ± to form integrin complexes which can function as collagen receptors. It can be involved in bladder fibrosis of diabetic contractile bladder dysfunction [22]. A notable down-regulation in gene expression was seen for SREBF1, PDGFRL, PBLD1, and CELF1, SREBF1, sterol regulatory elementary-binding transcription factor 1 plays a key role in glucose metabolism, fatty acid production and lipid production. It can be involved in diabetic contractile bladder dysfunction [23]. PDGFRL (platelet derived growth factor receptor like protein) is a cell surface tyrosine kinase receptor for members of the platelet derived growth factor. It is an important factor regulating cell proliferation. It can be involved in diabetic contractile bladder dysfunction [24]. The role of PBLD1 (phenazine biosynthesis-like protein domain containing 1 protein) in diabetic contractile bladder dysfunction is still not well known. CELF1 (CUGPB, Elav-like family member 5) is involved in mRNA translation. It might play a role in myotonic dystrophy [25]. It can be involved in diabetic contractile bladder dysfunction.
Heat map showed DEGs identified. Clusters of genetic patterns associated with STZ-DM bladder samples and controls were segregated implying a marked impact of DM on mRNA expression within the viscera. A statistical perspective of frequently arising biological process in the DAVID data group and to observe the outcomes of this process utilizing biologically pertinent pathways recognized by KEGG.
Genes were then classified according to their biological activities in order to correlate them with physiological alterations seen. A detailed account is presented subsequently to describe the way in which this strategy can detect reactions to diabetes, particular reactions in certain viscera and tissues. These findings could be interpreted in terms of their physiological applications. Current analyses exhibited the sensitivity necessary to recognize numerous genes associated with the neuromuscular system. They might therefore offer a more optimal description of etiologies and countering processes related to the neuropathy and myopathy seen in diabetic bladders. This information may generate potential targets for treatments.
Amongst various upregulated genes, major biological processes that emerged from the GO analysis included cytoplasm, filopodium, lamellipodium, negative regulation of potassium ion transport, intracellular, cell-cell junction, actin cytoskeleton, mRNA transcription from RNA polymerase II promoter, regulation of actin filament polymerization and sarcomere organization.
Pathways identified through KEGG revealed genes anticipated to participate in a number of biological pathways. Those related to upregulated genes included growth hormone synthesis, secretion and action, lipid and atherosclerosis, non-alcoholic fatty liver disease, toxoplasmosis and yersinia infection (Fig. 3). In keeping with these findings, contemporary work employing digital imaging microscopy techniques has demonstrated marked bladder remodeling in STZ-DM rodent models [16]. Taken together, these results indicate that a number of these targets might be forerunners of bladder impairment. The mRNA analysis method is difficult to determine a causal relationship. Indeed, the markers identified in our study were associated with general cytopathology. Therefore, the authors used the GO and KEGG enrichment analysis described above. Through this, it was possible to infer the possible mechanism of the changed marker.
Augmentation of carbachol-induced detrusor contractility associated with DM arises within the contractile governing intracellular mechanisms. The onset of nerve pathologies or neuronal degradation has been documented [14,26,27]. In general, the current results imply that gene expression alterations are in alignment with progression of reduced contractile function of the detrusor muscle and issues with its nerve supply [14,26,27]. At the point where the decompensated bladder dysfunction is advanced, the micturition pressure is diminished with a rise in residual urine volume after emptying. Thus, provoked polyuria can change the activity of the bladder in individuals with DM [28,29].
Contemporary high-throughput processing such as proteomics can provide a constantly evolving stream of de novo information on particular genes and proteins. This should be analyzed within the setting of cells and current established biological references. This contextual framework has been engendered by several protein network reference sources, such as the STRING database [30]. However, STRING database is not designed for expansive networks. Its plasticity for analysis and illustration of networks is restricted. Cytoscape software has been manufactured for use in sizeable networks. It offers a greater degree of tractability with respect to adding in further information and transposing such data onto existing networks [31,32]. Combination utilization of both software packages is therefore ideal, particularly for the interpretation of proteomic information. In the current research, outcomes from network analysis were in keeping with the downstream functional work which showed changes within the bladder in DM. Of interest, PDLIM3, PDLIM7 and ACTG2 formed core nodes with highest frequency within the network (Fig. 4). These were positively co-expressed together with their anticipated targets.
The strategy of analysis undertaken in this study could identify gene expression changes, together with biological pathways implicated in the etiologies underlying impaired bladder function in DM. This is promising for recognizing of particular mRNA reactions pertaining to the bladder in DM that might offer useful targets for diagnostic and treatment purposes.