Quantitative Sequencing Analysis of the Striatal Transcriptome in a Mouse Model of Alzheimer Disease
Article information

Abstract
Purpose
The purpose of this study was to analyze the transcriptomic changes in the striatum of amyloid precursor protein/presenilin 1 (APP/PS1) transgenic mice and uncover its association with the methyl-CpG binding protein 2 (MeCP2) mediated-changes in striatal epigenetic signature during Alzheimer disease (AD) pathological progression.
Methods
To observe transcriptomic alterations in the striatum before the onset of cognitive impairment in APP/PS1 mice, quantitative 3’mRNA sequencing was performed with RNA extracted from the striatum of 6-month-old and 12-month-old wildtype and APP/PS1 mice. In addition, chromatin immunoprecipitation sequencing was conducted with the DNA from wildtype and APP/PS1 mice of the same age as aforementioned. For transcriptomic analysis, comparison terms were constructed based on aging and transgene expression—normal-aging (12-month-old wildtype/6-month-old wildtype), early-AD (6-month-old APP/PS1/6-month-old wildtype), and late-AD (12-month-old APP/PS1/6-month-old wildtype). To compare the changes in biological pathways and networks, we analyzed gene lists from each comparison term via bioinformatics tools including DAVID (Database for Annotation, Visualization, and Integrated Discovery), STRING (Search Tool for the Retrieval of Interacting Genes/Proteins), and SynGO (Synaptic Gene Ontologies). Furthermore, to assume the effect MeCP2 in AD pathological conditions may have on the transcriptome regulation, analysis of the common genes from Quant-Seq and MeCP2-ChIP-Seq was performed.
Results
Enriched pathways including immune system and inflammatory response were confirmed in normal- aging and lateAD, respectively. In particular, enriched pathways of gene expression regulation, transcriptional regulation, and protein catabolic pathways were found to be significantly altered in early-AD. MeCP2-bound genes that were significantly altered in the transcriptome were suggested to be target genes that have a role in the striatum of the early-stage AD model.
Conclusions
This study confirmed that the alteration of the striatal transcriptomic profile in APP/PS1 mice was involved with several biological pathways. Additionally, comparative analysis of the transcriptomic changes and the MeCP2 bound regions found that a group of differentially expressed genes may be regulated under the epigenetic control of MeCP2.
• HIGHLIGHTS
- AD in its early stages may be an important timepoint for altering the regulation of gene transcription in the striatum.
- MeCP2 induced transcriptomic regulation in the diseased striatum indicate a specific target gene group in the brain.
INTRODUCTION
Aberrant alterations in transcriptional regulation significantly contribute to the deterioration of the organism into a disease-like state. Like in other organs, gene expression controlled by transcriptional regulation in the brain plays an essential role in the execution of normal brain function [1]. In Alzheimer disease (AD) patients and animal models of AD, multiple events of transcriptomic dysregulation were reported during the onset of cognitive decline [2]. By elucidating the mechanisms of brain function that lead to the deterioration of AD pathogenesis, new target genes and pathogenic mechanisms of AD may be identified and subject to extensive study for the therapeutic treatment of AD.
Transcriptome profiling compares data between biological samples to qualitatively and quantitatively identify transcriptomic changes under specific experimental conditions. With next generation sequencing (NGS)-based RNA sequencing methods, the sequence information of transcript variants and the transcription fold change (FC) level within all transcriptome reads can be determined [3]. Among various types of RNA sequencing methods, quantitative sequencing, or 3’mRNA sequencing method (Quant-Seq) is based on the information from the reads of the cDNA library under the scale of 100 base pairs. Through mRNA Quant-Seq, the changes in the expression level for most genes present in the transcriptome between groups can be compared. In this study, we compared the changes in expression level between groups for a subset of genes present in the transcriptome and was able to uncover a list of differentially regulated genes [4].
MeCP2 is a methylated CpG island binding protein that was first discovered as a transcriptional repressor [5,6]. However, lines of evidence suggest diverse MeCP2 function depending on the interaction with various proteins and the binding location [7]. Therefore, exploring where MeCP2 binds on the genome may highlight gene targets that have been altered in the disease state. Chromatin immunoprecipitation sequencing (ChIP-Seq) is characterized by the binding of an antibody specific to a DNA-binding protein or histone modification to conduct NGS and generates datasets that can be analyzed to provide information about genome-wide binding events [8]. ChIP-Seq, by immunoprecipitating transcriptional factors, can be used to search for highly bound or enriched genomic regions that may be regulated by these transcriptional factors and be used to observe functional annotations in downstream analyses to potentiate target genes.
The striatum is expected to play a significant role in the cognitive decline accompanying the onset of AD [9]. In this study, mRNA Quant-Seq analysis was performed using the total RNA isolated from the striatum of 6-month-old and 12-month-old amyloid precursor protein/presenilin 1 (APP/PS1) and wildtype (WT) mice. The list of significantly altered genes found to be changed in either direction was selected, and the genes in each predefined comparison terms were analyzed with Database for Annotation, Visualization, and Integrated Discovery (DAVID), Search Tool for the Retrieval of Interacting Genes/Proteins (STRING), and Synaptic Gene Ontologies (SynGO). Furthermore, we compared and found a list of common genes from the ChIP-seq and Quant-seq datasets, and searched for potential genes involved in the brain. Through this, we aimed to understand whether alteration in the striatum-specific gene expression could affect the striatal function during the onset of AD, and suggested that gene expression regulation in the early stages of AD could play a critical role in AD.
MATERIALS AND METHODS
Animals
Six-month-old and 12-month-old male APPswe/PSEN1dE9 (line 85) transgenic mice of C57BL/6;C3H background from Jackson Laboratory (Bar Harbor, ME, USA, stock number 004462) and the littermate WT mice were used. All mice were maintained at the specific pathogen-free facility of the Korea Institute of Science and Technology (KIST) Research Animal Resource Center prior to use. Mice were placed in group housing on a reverse 12-hour day-night cycle with maintenance of the temperature and the humidity. All mice were supplied with water and food ad libitum. All experimental procedures including the usage and treatment of animals were approved by the Animal Care and Use Committee of KIST (approval number: KIST-5088-2022-08-133).
mRNA Quant-Seq and Sequencing Data Analysis
Total RNA of microdissected frozen striatum tissue was isolated with Trizol treatment (Invitrogen, Waltham, MA, USA). Agilent 2100 bioanalyzer and the RNA 6000 Nano Chip (Agilent Technologies, Amstelveen, The Netherlands) were used for RNA quality assessment and ND-2000 Spectrophotometer (Thermo Fisher Scientific Inc., Waltham, MA, USA) was used for the quantification. The library was constructed for each total RNA sample using QuantSeq 3’ mRNA-Seq Library Prep Kit (Lexogen GmbH, Wien, Austria) according to the manufacturer instruction. Single-end 75 high-throughput sequencing was performed with NextSeq 500 (Illumina, Inc., San Diego, CA, USA). Alignments of sequencing reads were performed with Bowtie2. Indices were either generated from the representative transcript sequences or the genome assembly sequence aligning to the genome and transcriptome. Files of alignment were used for transcripts assembly for the estimation for abundances and detection of the differential expression of genes. Differentially expressed genes (DEGs) were determined based on the read count (RC) and the FC level from multiple alignments.
Analysis of Gene Ontologies and Kyoto Encyclopedia of Genes and Genomes From DAVID
To identify the functional pathways from queries of multiple gene sets from the DEG analysis and to uncover the regulatory network on the basis of biological processes (BPs) and molecular functions, the pathway enrichment analyses of Kyoto Encyclopedia of Genes and Genomes (KEGG) and gene ontology (GO) were performed simultaneously (www.genome.ad.jp/kegg; www.ebi.ac.uk/QuickGO) [10,11]. The lists of DEGs from multiple comparisons were matched onto the DAVID followed by listing pathways from KEGG and GO.
Protein-Protein Interaction Analysis From STRING
The STRING database (https://string-db.org/, Version 11) was used to predict protein-protein interaction (PPI) network from the lists of DEGs from multiple comparison [12]. The potential targets of DEGs were input into the STRING database and PPI data was obtained. The result was saved in table separated valueformat. Node 1, node 2, and combined score information in the file were retained and imported into Cytoscape software to draw the interaction network.
Gene Ontology Analysis of Neuronal Functions From SynGO
To demonstrate significant enrichment of genes associated with both presynaptic and postsynaptic structures, the SynGO analysis, a publicly available database for synapse research, was used [13]. From the specifically curated GO database of SynGO, multiple genes with annotated synaptic functions were selected from the queries of each list of DEGs. The BP and cellular component classes were analyzed, and the visualization tool was used to evaluate the function and location of each synaptic gene. Furthermore, enrichment studies were conducted with the synaptic genes.
Weighted Gene Coexpression Network Analysis
Weighted gene coexpression network analysis (as performed in [14]) was used to identify associations of gene expression changes in the striatal region within WT and APP/PS1 mice. The expression values of each gene were analyzed via pairwise correlations analysis and the coexpression networks were defined as modules. An undirected connection between each gene with significant relationships was used to establish the coexpression network. The module eigengene was characterized as the first principal component of each module from the principal component analysis.
Comparative Analysis of ChIP-Seq and 3’Quant-Seq Datasets
To find genes that may be affected by MeCP2 transcriptional regulation, all peak regions enriched by MeCP2 binding yielded by the MACS2 algorithm [15], and significant DEGs found through the EdgeR package [16] were used in the Venn diagram analysis. For the MeCP2 bound regions, genes corresponding to the genomic regions with a fold-enrichment >1.7 were counted. In finding the significant DEGs in the Quant-Seq dataset comparing the 6 and 12-month APP/PS1 mice to WT, a cutoff value of FC>1.3 (including both increase and decrease in gene expression FC), P<0.1, and log2 normalized expression value >2 was used. A more stringent cutoff value of FC>1.5, P<0.05, and log2 normalized expression >2, did not yield sufficient number of DEGs to result in an overlap between the 2 datasets to be used in functional annotation. Overlap between the 2 datasets showed genes that were expected to be both bound by MeCP2 and highly changed in gene expression in the striatum of APP/PS1 mice.
RESULTS
Transcriptomic Profiling of the Striatum of APP/PS1 and Analyses of Gene Expression Changes in the Normal-Aging and the Late-AD Comparisons
In order to understand the transcriptomic alterations in the striatum during the onset of cognitive decline in APP/PS1 mice, mRNA Quant-Seq experiments were performed using RNA extracted from the striatum. For the WT and APP/PS1 mice, striatal samples at 6 and 12 months of age were analyzed respectively, and 3 comparison groups were defined as normal-aging, early-AD, and late-AD. The normal-aging, early-AD, late-AD terms were used as constructs to compare the aging effect on gene expression in the pathological conditions in the WT and AD model. In the normal-aging term, the aging effect was assumed by comparing the gene expression in 6-month-old WT and 12-month-old WT datasets. For the early-AD and late-AD terms, the aging effect during pathological conditions was assumed by comparing the gene expression of 6-month-old and 12-month-old APP/PS1 mice with its matching age WTs (6-month-old APP/PS1/6-month-old WT; 12-month-old APP/PS1/12-month-old WT). For each comparison group, DEGs showing an increase or decrease of FC>1.3 and P<0.1 were selected. In each comparison, 1,038, 560, and 791 genes for normal-aging, early-AD, and late-AD, respectively, were identified as genes showing significant changes (Fig. 1).
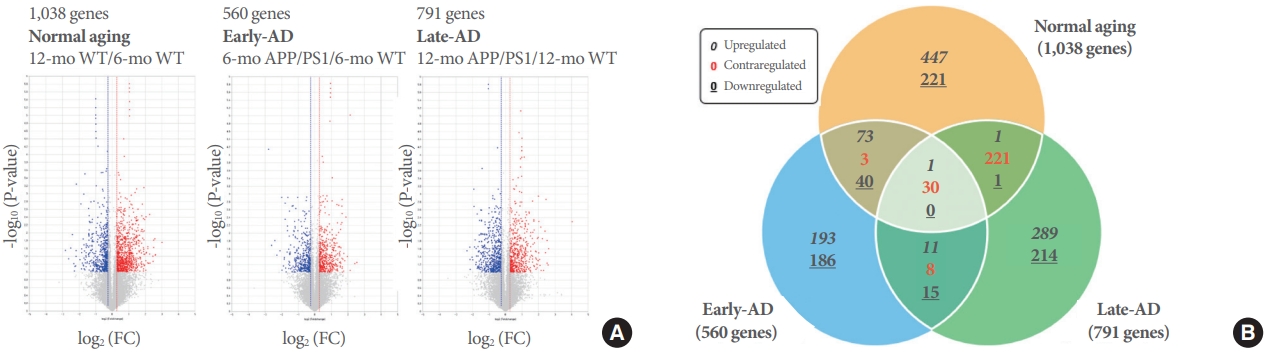
Volcano plots and Venn diagram representations of the DEG analysis from the QuantSeq analysis. (A) Volcano plots showing selected genes from 3 comparison groups. Blue-colored dots indicate genes with decreased fold change (FC) in gene expression and red-colored dots genes with increased FC in gene expression. For each comparison group, 1,038 (normal-aging), 560 (early-AD), and 791 (late-AD) genes were identified as genes with statistically significant changes. (B) Venn diagram analysis of lists of selected genes in the normal-aging, early-AD, and late-AD. The legend in the box shows the direction of regulation of genes in the intersecting areas, which is shown as either italic (upregulated), red-bolded (contraregulated), or bolded with underline (downregulated). The number of significant DEGs were presented for each set of the Venn diagram. DEG, differentially expressed gene; WT, wildtype; AD, Alzheimer disease; APP/PS1, amyloid precursor protein/presenilin 1.
Subsequent analyses were performed using the list of genes from each comparison and their FC and RC values. As a result of DAVID and STRING analysis of the normal-aging gene list, GOs including immune system (GO:0002376, GO:0045087, GO:0002218) and inflammatory response (GO:0006954, GO: 0050729) were enriched, and the term “aging” (GO:0007568) in the BP was annotated. When GOs of genes annotated to the synaptic function were analyzed using SynGO, significantly altered genes of various synaptic GOs were uncovered. For the GO analysis of the late-AD gene list, inflammatory response (GO:0006954, GO:0050729) was annotated with the “oxidative stress” term (GO:0034599). In particular, multiple GOs related to the brain functions including “learning or memory” (GO: 0007611) and microtubule function (GO:0003777, GO: 0008017, GO:0000146) were enriched. These results suggest that biological pathways implicated in the normal-aging and late-AD were altered at the transcriptomic level in the striatal regions of the brain.
Early Transcriptomic Changes in AD Pathogenesis Were Involved With Pivotal Biological Pathways of Gene Expression Regulation and Protein Catabolism
To observe the transcriptomic changes in the early stages of AD pathology in APP/PS1 mice (6-month-old APP/PS1 vs. 6-month-old WT), Quant-Seq gene datasets from 6-month-old WT and APP/PS1 mice were analyzed further with multiple bioinformatics tools. A total of 560 significantly changed genes consisting of 307 genes with increased expression, and 253 genes with decreased expression were screened. Unlike the analyses with normal-aging and late-AD datasets, the GO analysis of early-AD showed numerous characteristic terms specifically dealing with the alteration in gene expression including the regulation of the transcription process (GO:0006355, GO:0006351, GO:0032088, GO:0045944). In addition, several pathways related to the digestion and absorption of proteins (GO:0019538, GO:0044257) were identified (Fig. 2). PPI of these genes were also analyzed through STRING analysis (Fig. 3). PPI results revealed an interaction network of significantly expressed genes (either increased or decreased in expression) in early-AD at the protein level. In the SynGO analysis, a greater number of altered genes was confirmed in the early-AD than in late-AD. When multiple modules of genes with similar expression levels in the Quant-Seq data were analyzed through coexpression analysis, 111 genes with decreased expression in the light green module and 70 increased genes in the dark red module showed significant values for the Pearson correlation coefficient. Moreover, GO analysis also showed multiple pathways related with transcriptional regulation and protein catabolic processes (GO:0006512, GO:0004842, GO:0004843, GO:0016580, GO:0042788, mmu04120) in the cell (Fig. 4). These analyses suggested that early transcriptomic alterations in the striatal region may regulate several pathways implicated in the transcriptional regulation and the protein catabolism in APP/PS1 mice.

Biological process (BP) pathway analysis of the 560 differentially expressed genes in the early- Alzheimer disease (AD) comparison term. Through pathway analysis in DAVID (Database for Annotation, Visualization, and Integrated Discovery), the QuantSeq results in the early-AD were summarized as gene counts and P-values for each gene. The green and red bars for each BP term of the y-axis represent the number of genes decreased or increased in each pathway (lower x-axis), and the value from the blue line is indicated as -log10 (P-value) of each enrichment analysis (upper x-axis).
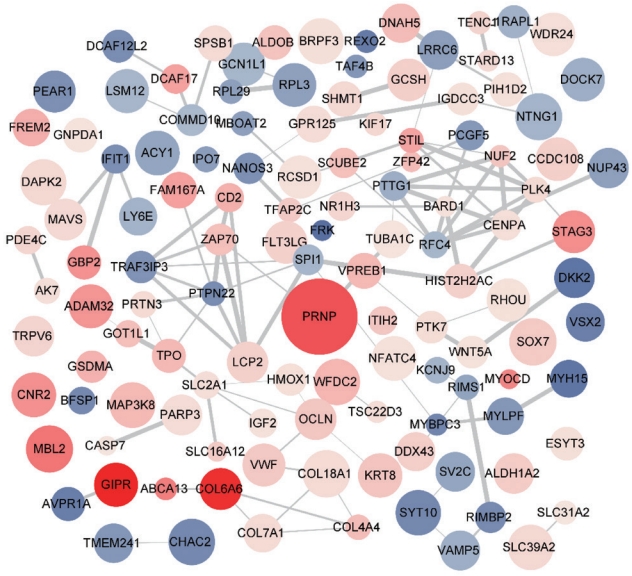
Protein-protein interaction (PPI) analysis using STRING (Search Tool for the Retrieval of Interacting Genes/Proteins) for the 560 DEGs of the early-AD comparison term. Each protein displayed with the blue and red node indicated decreased or increased expression, respectively. The size of nodes represents the P-value of the fold change analysis and the width of edges linking 2 nodes denote the score of mutual interaction. Literatures from the text-mining, experimental results, in-silico databases, and co-occurrence options were selected for the PPI analysis of the 560 DEGs from the early-AD comparison term. DEG, differentially expressed gene; AD, Alzheimer disease.
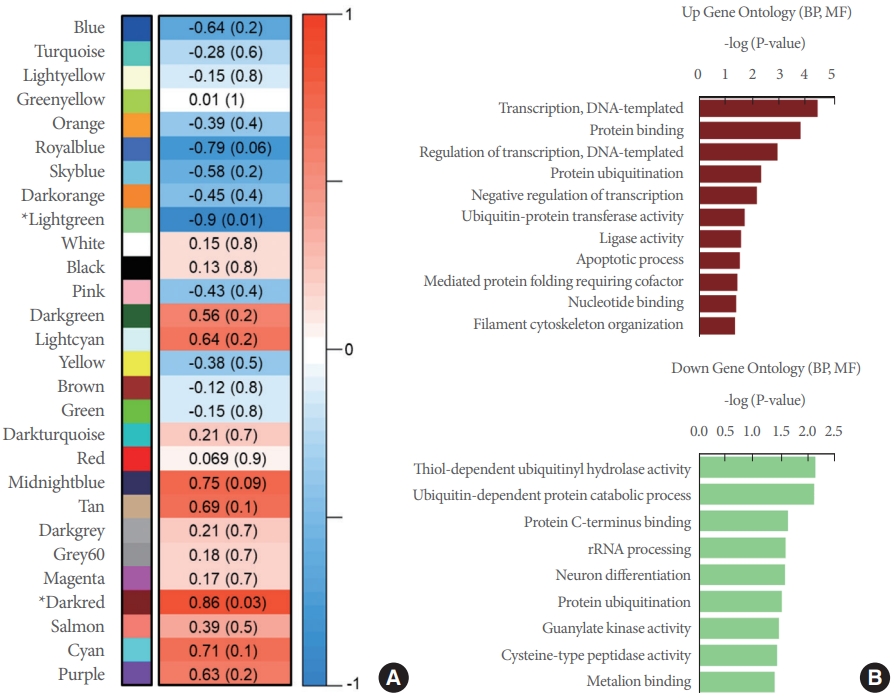
Results of coexpression analysis based on the RC values from the early-AD comparison term. (A) Red values indicate increased coexpression modules and blue values indicate decreased coexpression modules. Asterisks on modules indicate modules with significant changes (P<0.05). Values within the boxes denoting each module are fold changes and P-values (in parenthesis). (B) The graph shows the significance of upregulated and downregulated biological process (BP) and molecular function (MF) terms obtained through through DAVID (Database for Annotation, Visualization, and Integrated Discovery) analysis of the genes of dark red module and light green module. AD, Alzheimer disease.
Comparative Analysis of Quant-Seq and the MeCP2-ChIP-Seq Reveals Specific Target Gene Group of MeCP2 in the Striatal Transcriptome of APP/PS1
In order to reveal changes in gene expression that may be regulated specifically by MeCP2-binding in the AD pathology affected striatum, we extracted genes corresponding to enriched peaks from ChIP-Seq (performed as previously described in [9]) MACS2 analysis [15], and significantly altered DEGs from the early-AD and late-AD datasets (Fig. 5A). As MeCP2 is known to be involved in transcriptional regulation by epigenetic mechanisms, we hypothesized that the enrichment of MeCP2-bound genomic regions would entail the effects MeCP2 regulation has on the changes in gene expression. In this, we assumed that the overlap between the ChIP-seq and Quant-Seq datasets would shed light on potential regulatory effects MeCP2 may have in altering the expression of genes in the transcriptome of APP/PS1 mice. However, as transcriptomic analysis of the early-AD term highlighted various biological pathways implicated in transcriptional regulation, we chose to analyze DEGs in early-AD over other comparison terms. Therefore, we conducted a Venn diagram analysis and generated a list of common genes that were both MeCP2-bound and were significantly altered transcripts originating from the striatum of 6-month-old APP/PS1 and WT mice (Fig. 5B). Although there was a low overlap of genes comparing the early-AD genes to the entire MeCP2-bound regions, nearly 48.5% of the entire early-AD genes were significantly regulated while predicted to be within MeCP2 bound regions, whereas late-AD genes were 54.2%. Then, we proceeded with bioinformatics analysis in SynGO as the GO terms are manually curated to include genes within GO terms specific to the brain. Through SynGO, the list of common genes that were MeCP2-bound in early-AD was matched to assume genes particular to synaptic function and location (Fig. 5C).
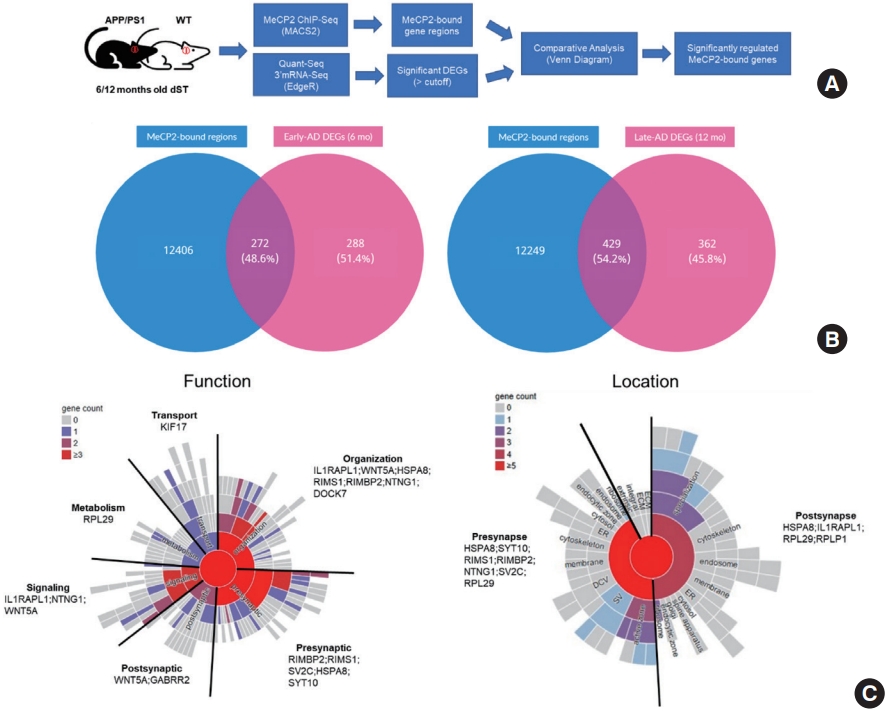
Common genes in ChIP-Seq and Quant-Seq 3’mRNA-seq. (A) Flow chart detailing the experimental procedure for the output of overlapping genes from Quant-Seq and ChIP-Seq. (B) (Left) Venn Diagram of MeCP2 bound-regions and DEGs of 6-month old WT and APP/PS1 mice. The number and percentage of genes in each category is indicated for each group. The percentage was calculated based on the number of overlapping genes/total DEGs. (Right) Venn Diagram of MeCP2 bound-regions and DEGs of 12-month old WT and APP/PS1 mice. The number and percentage of genes in each category is indicated for each group. (C) (Left) Graph from SynGO showing the number and names of common genes from the early-stage AD model that was included in the GO terms (including child terms) detailing synaptic function. (Right) Graph from SynGO showing the number and names of common genes from the early-stage AD model that was included in the GO terms (including child terms) detailing synaptic location. Genes in the highest order GO terms are displayed. The legend based on color scheme indicates the number of genes in each GO term and its child terms. ChIP-Seq, chromatin immunoprecipitation sequencing; DEG, differentially expressed gene; WT, wildtype; APP/PS1, amyloid precursor protein/presenilin 1; SynGO, Synaptic Gene Ontologies; AD, Alzheimer disease; GO, gene ontology.
DISCUSSION
We report a transcriptomic analysis of the striatum of WT and APP/PS1 mice in the normal-aging, early-AD, and late-AD stages, and predict significant DEGs that may be targeted by MeCP2.
To elucidate the alteration of the striatal transcriptome in respect to the aging effect in AD pathological conditions, we conducted Quant-Seq analysis with the following comparison terms: normal-aging, early-AD, and late-AD. Through the analysis of the normal-aging comparison term, our Quant-Seq dataset analysis was shown to be reliable as genes associated with the “aging” GO term were significantly enriched in the DAVID analysis (data not shown). Moreover, GO terms that were associated with characteristic deficits in response to aging such as immune system and inflammatory response were also found through DAVID and STRING, further increasing the reliability of this study [17,18]. Even in the analysis for the late-AD comparison term, the dataset resulted in GO terms such as “learning or memory” and Tau-mediated microtubule binding, indicating that the dataset from the APP/PS1 mouse also reflected changes in the regulation of gene expression from AD pathological conditions [19].
In contrast to changes in normal-aging and late-AD that were characteristic to each comparison term, analysis of the early-AD term showed changes in transcriptional regulation and the protein catabolism even prior to the emergence of cognitive deficits. These results suggest gene targets for potential therapeutics in the early stages AD pathology [1]. Notably, it has been reported that changes in catabolism by transcriptional regulation may be effective targets in AD pathology [20].
Common genes listed from an overlap of MeCP2-bound regions and significantly altered DEGs indicate genes that may provide insight into the MeCP2 mediated transcriptomic changes. However, several assumptions are made in interpreting the importance of these common genes - the traditional role of MeCP2 as a transcriptional regulator is assumed, and the specific location of genomic binding may have a similar impact on transcriptional regulation. Nevertheless, the common genes provide that this group of genes are predictive and may have aberrant expression pertaining to MeCP2 binding in response to conditions early in the AD pathology. The listed genes in the SynGO specifically show a group of genes expressed in the brain that may be potential targets for regulation in early-AD. An particularly interesting gene target is Wnt5a, which is a secreted signaling protein of the noncanonical Wnt signaling pathway involved in neural development and plasticity, and has been mapped onto the AD KEGG pathway (mmu 05022) [21]. In AD, Wnt5a is impacted by DKK1 which acts as a Wnt signaling antagonist, and Aβ oligomers seem to upregulate DKK1 thereby inhibiting Wnt5a [22-24]. However, the change in Wnt5a expression seems to be dependent on the progression of AD pathology. Consistent with the increase in FC of Wnt5a in the early-AD term (data not shown), Wnt5a expression in APPswe/PSEN1ΔE9 mice of 3.5 months of age was reported to be upregulated in vitro, and Wnt5a mediated activation of the noncanonical Wnt signaling pathway led to Aβ-induced synaptic damage [20,25]. This suggests that Wnt5a aberrant expression in the early-AD may be an important marker to indicate a timepoint prior to severe neurotoxicity. Therefore, further studies are required to assess Wnt5a methylation and quantitatively validate whether the expressions of the common genes are indeed changed in the striatum of the early-AD mouse model. As a result of the comparative analysis of common genes, we have specified a target gene group in the brain that may be important in early-AD.
Our study is the first to explore the transcriptomic signature in the striatum of APP/PS1 and WT mice, while also observing MeCP2 epigenetics. Through systematic classification of age groups to reflect the aging effect in the pathological conditions of AD mouse models, we were able to highlight early-AD as an important timepoint in the alteration of the transcriptome. Inflammatory response pathways were found to be associated with normal-aging and late-AD, although specific pathways in the inflammatory response were distinct - inflammatory response was revealed with immune system in normal-aging and inflammatory response was annotated with oxidative stress in Late-AD. For further analysis to predict the effect MeCP2 may have on the transcriptional alteration in early-AD, we specified a target group of genes in the brain. Targeting these genes early in the AD pathology may prove to be an effective approach in developing therapeutics for AD.
Notes
Funding/Grant Support
This work was supported by the Intramural grants by Korea Institute of Science and Technology (Grant No. 2E31522, 2E31700, 2E31524) to HII.
Research Ethics
All experimental procedures for the usage and the treatment of animals were approved by the Korea Institute of Science and Technology (KIST) Institutional Animal Care and Use Committee (KIST-5088-2022-08-133).
Conflict of Interest
No potential conflict of interest relevant to this article is reported.
AUTHOR CONTRIBUTION STATEMENT
·Conceptualization: TKK, SL, HII
·Data curation: TKK, SL, HII
·Formal analysis: TKK, SL
·Funding acquisition: HII
·Methodology: TKK, SL
·Project administration: HII
·Visualization: TKK, SL
·Writing - original draft: TKK, SL, HII
·Writing - review & editing: TKK, SL, HII