


• HIGHLIGHTS
- We identified brain site dependent alternative splicing that may explain a molecular pathology underlying AD progression.
- Genes related to axonogenesis were alternatively spliced in both regions (i.e., frontal and temporal).
- Frontal-specific (CLU and NTRK2) and temporal-specific (HIF1A and TRPC4AP) ES genes were associated with AD progression.
INTRODUCTION
Alzheimer’s disease (AD) is a neurodegenerative disease and the leading cause of progressive cognitive impairment [1]. It has a neuropathological hallmark comprising several clinical features including extracellular amyloid-β (Aβ) plaques, intracellular neurofibrillary tangles, and intraneuronal neurofibrillary tangles consisting of hyperphosphorylated tau protein [2]. Genetic susceptibility factors have been demonstrated to contribute extremely to neuropathogenesis during AD progression, although a considerable portion of genetic heritability remains not yet fully explained [3]. A previous study identified single nucleotide polymorphisms (SNPs) in CLU, a known AD-risk gene, as risk factors associated with multiple AD pathologies including increased cerebrospinal fluid levels, which are a marker for tau protein deposition [4,5]. Furthermore, accumulated evidence suggests that transcriptional alterations (e.g., gene expression and alternative splicing [AS]) are observed during the onset and development of AD [6,7]. In particular, whole-transcriptome sequencing analyses have revealed that AS of AD-risk genes may play a critical role in AD pathology. For example, alternatively spliced exons of the risk genes RELN and NOS1 are reportedly associated with cortical Aβ levels [8].
AS is among the most important modes of posttranscriptional regulation; it generates multiple mRNAs from a single gene by selecting different combinations of exons, thereby providing functional complexity [9]. In eukaryotes, fully 95% of genes undergo AS; moreover, the brain is among the tissues most profoundly regulated by alternatively spliced genes. Known AD-risk genes (e.g., APP [10], APOE [10], PSEN1 [11], and TREM2 [12]) undergo AS-mediated regulation in the brain that contributes to complicated cell-specific functions, neuronal development, and synapse function, with abnormal AS regulation leading to diverse neurological disorders, including AD.
As AS regulation establishes brain site-specific functions, it may contribute to region-specificity by producing different mRNA isoforms across to the brain regions, which isoforms are then transcribed into different functional proteins [9]. Notably, the severity of symptoms and neuropathological features in AD patients often depends on brain-regional variation [13]. For instance, the Braak staging system, which is the most widely used and accurate assessment of AD pathological severity [2,14], is based on brain-regional variation of tau neurofibrillary tangle aggregation, specifically tau aggregation in the transentorhinal region (stage 1), entorhinal and hippocampus regions (stage 2), inferior temporal region (stage 3), medial and superior temporal gyrus (stages 4 and 5), and finally sensory association areas (stage 6) [15]. Therefore, there is considerable appeal in studying brain regional AS mechanisms of neuropathological features in AD, the better to advance our understanding and identify further molecular mechanisms that underlie AD progression. Indeed, one study has demonstrated that brain regionspecific AS regulation in humans play significant roles in risk of neurological traits and diseases, including AD [16]. However, while a recent study explored region-dependent regulatory effects on gene expression [17], the region-dependent AS mechanisms underlying AD pathologies remain elusive.
Here, we investigated regional-dependent association of exon skipping (ES) events (i.e., the most common type of AS) in ADrisk genes with 2 clinical features (i.e., Braak stage, plaque density mean [PM]) based on RNA sequencing (RNA-Seq) and clinical data. Transcript sequences were obtained from 4 distinct brain regions of AD patients, generated by the MSBB project [18]: 2 frontal (frontal pole [FP], n=175 and inferior frontal gyrus [IF], n =87) and 2 temporal (parahippocampal gyrus [PH], n=93 and superior temporal gyrus; [ST], n=101).
MATERIALS AND METHODS
The overall study design is illustrated in Fig. 1. RNA-Seq,, clinical, and whole-genome sequencing (WGS) data were employed to determine which ES events associate with AD pathological features, and moreover to identify their genetic regulators. Demographic information of samples analyzed in this study for each region is described in Fig. 1.
RNA-Seq Data Analysis
We obtained RNA-Seq data and clinical data from the synapse database (www.synapse.org). These data were generated from the Mount Sinai Brain Bank project (MSBB, synapse id = syn7416949) of the Accelerating Medicines Partnership-Alzheimer’s Disease (AMP-AD) project [18]. The RNA-Seq reads were obtained from postmortem brains of 456 AD cases: FP (BA10, n =175), IF (BA44, 87), PH (BA36, n =93), and ST (BA22, 101). We aggregated the 4 regions into 2 sub-brain regions: (1) frontal region including FP and IF and (2) temporal region including PH and ST. The RNA-Seq data for all cases were obtained on a Illumina HiSeq 200 system as 100 nt singleend reads. We downloaded the reads (as bam files) from synapse, and converted all mapped reads into fastq format using SAMtools [19]. Then, we mapped the converted fastq files to the human reference genome (GRCh37.75, based on hg19) using STAR aligner v2.5 which provides high accuracy and outperforms other aligners [20]. We targeted and investigated 686 AD-risk genes identified from multiple genome-wide association studies (GWASs) [21], identifying ES events in those genes and estimating their skipping rates as the percent spliced in (PSI), defined as the ratio of the relative abundance of all isoforms containing a certain exon over the relative abundance of all isoforms of the gene to which the exon belongs; this was done with rMATs v3.2.5 [22]. A PSI value of zero indicates that all mRNAs transcribed from the gene skip the given exon, while a value of one means that the given exon is never skipped.
Clinical Data Analysis
We downloaded and analyzed the clinical information of AD cases ascertained with RNA-Seq data samples [18]. We specifically investigated 2 critical pathological features of AD (i.e., Braak stage and PM) to identify ES splicing rates associated with those features for each brain region under study. For Braak stage [15], we classified the samples into 3 groups according to disease severity: stage 1-2=low AD severity, stage 3-4=middle AD severity, and stage 5-6=high AD severity. For PM, we considered it as a continuous variable for the statistical association test.
Association Analysis Between ES and Clinical Traits
We performed a linear regression test between ES levels as PSI and pathological features (e.g., Braak stage and PM) for each brain region and for each feature, as shown in the association analysis section of Fig. 1. Sex was utilized as a covariate, and we considered an association to have statistical significance according to a criterion: adjusted false discovery rate (FDR) values from the linear regression model <0.05.
Functional Enrichment Analysis of ES Genes Associated With Neurological Features
To evaluate the functional roles of genes for which ES was associated with neurological features, we carried out gene set overrepresentation analysis based on Gene Ontology (GO) terms using Gorilla [23], a web-based application for gene set enrichment analysis. The 686 AD-risk genes of our focus set were used as the background, and we considered GO terms with FDR <0.1 as statistically significant in order to obtain a more comprehensive set.
Identification of cis-Regulators: Splicing Quantitative Trait Loci From WGS Data Analysis
To identify regulators of the ES events identified as associated with AD pathological features, we integrated WGS data of the samples ascertained with RNA-Seq. This WGS dataset was also downloaded from synapse (id=syn3159438 [18]) as a vcf file. We performed a linear regression test between ES levels as PSI and the genotypes of SNPs within both ES exons and their flanking introns with adjustment for sex as a covariate for each of the 2 aggregated brain regions (frontal and temporal). FDR <0.05 was taken as the threshold for identifying significant splicing quantitative trait loci (sQTLs).
RESULTS
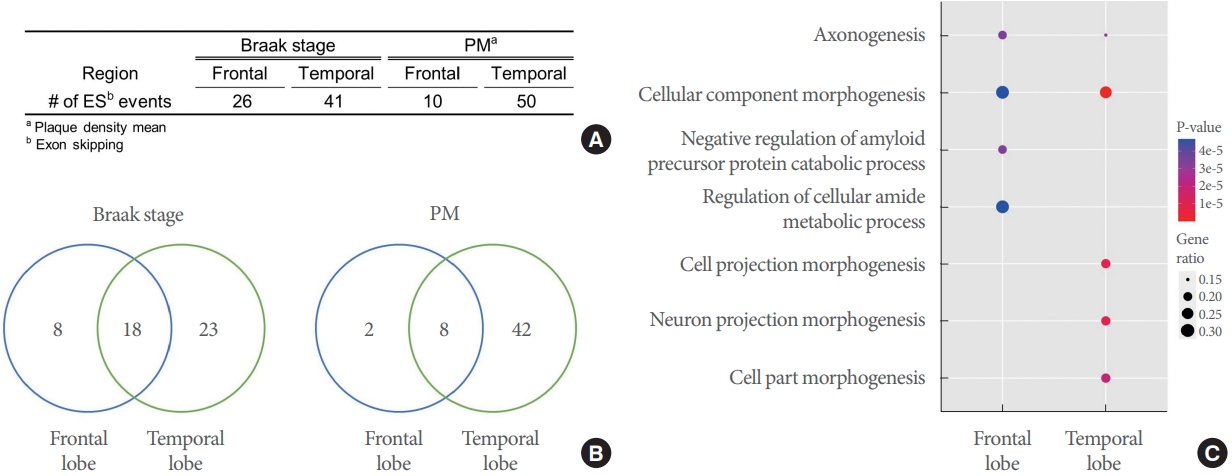
Identification of Braak-Associated and PM-Associated ES Events for Each Brain Region in AD
As mentioned above, we performed an association test of ES PSI rate and disease features. This analysis identified 26 and 10 ES events respectively associated with Braak and PM in the frontal lobe, and 41 and 50 ES events in the temporal lobe (Fig. 2A, Supplementary Table 1). Among Braak-associated ES exons, 8, 23, and 18 were frontal-specific, temporal-specific, and shared ES exons, respectively; of PM-associated exons, 2, 42, and 8 were observed in frontal, temporal, and both, respectively (Fig. 2B). Next, we aggregated the feature-associated ES events for each region to conduct gene set enrichment analysis and obtain reliably significant GO terms. For example, we carried out enrichment analysis on all genes corresponding to the total 36 frontal-ES exons (i.e., 26 Braak-associated + 10 PM-associated ES events in the frontal region). Thus, we obtained significant GO terms with FDR <0.05 for genes having frontal-only, temporal-only, or mutual frontal-temporal associations (Fig. 2C, Supplementary Table 2). Interestingly, the term “axonogenesis,” which relates to generation of neurons through the building of axons in the brain [26], was identified as enriched among both frontal-ES and temporal-ES genes, while the terms “amyloid precursor protein (APP) process related” and “neuron projection morphogenesis” were singularly enriched among frontal-ES and temporal-ES genes, respectively.
Protein-Protein Interaction Network of Neuropathological-Associated ES Genes
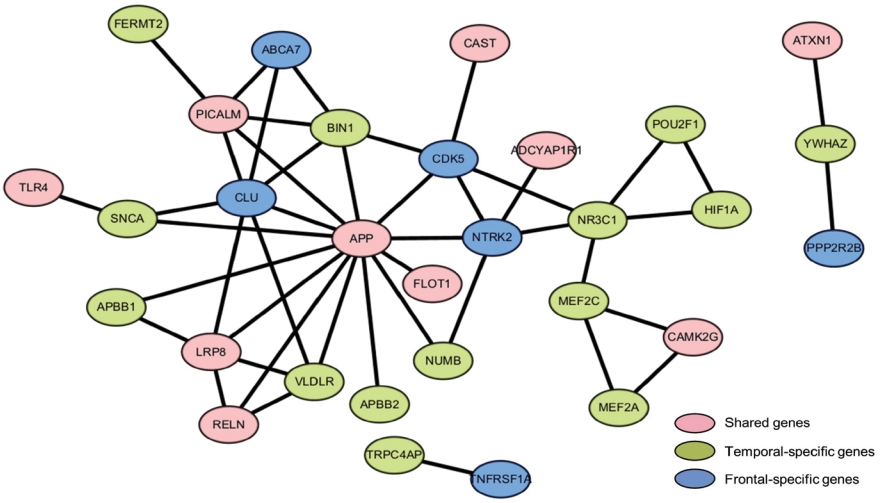
To obtain further molecular signature information concerning ES genes associated with Braak stage and PM, we constructed a protein-protein interaction network from all associated genes, inclusive of the 6, 14, and 10 respective frontal-specific, temporal-specific, and shared associated genes (Fig. 3). We did not observe any specific subnetwork for frontal-specific or shared-ES gene sets, but for the temporal-specific genes, we identified a subnetwork comprising 5 temporal-specific genes and 1 shared gene (i.e., POU2F1, HIF1A, NR3C1, MEF2C, MEF2A, and CAMK2G). To evaluate the functional roles of these genes, we performed overrepresentation analysis across canonical functional pathways (i.e., Reactome [27] and KEGG [28]) using ConsensusPathDB [29] with all AD-risk genes as the background set. This analysis identified significant overrepresentation in several AD-related functional pathways, namely the ERK/MAPK signaling pathway (FDR=0.00166 in Reactome), Interleukin-17 signaling (FDR=0.00229 in Reactome), and the Apelin signaling pathway (FDR =0.00952 in KEGG) [30].
Identification of cis-Genetic Regulators (sQTLs) for Neuropathological Features Associated With ES Exons
Genetic variants (single nucleotide polymorphisms [SNPs]) could be regulators of the identified ES events. In particular, SNPs within ES exons and their flanking introns can change splicing patterns by remodeling the binding affinities of splicing factors; such variants are termed sQTLs [31]. Through integrative analysis of WGS and RNA-Seq, we revealed 418 significant sQTLs associated with total of 44 ES events (44% of the total set) observed from frontal and temporal regions (Supplementary Table 3). For example, ES exons in CAST and APP could be associated with Braak stage and PM through sQTLs positioned at chr5:96060262 and chr21:27355813, respectively.
Braak- and PM-Associated ES Exons Shared Between Frontal and Temporal Regions
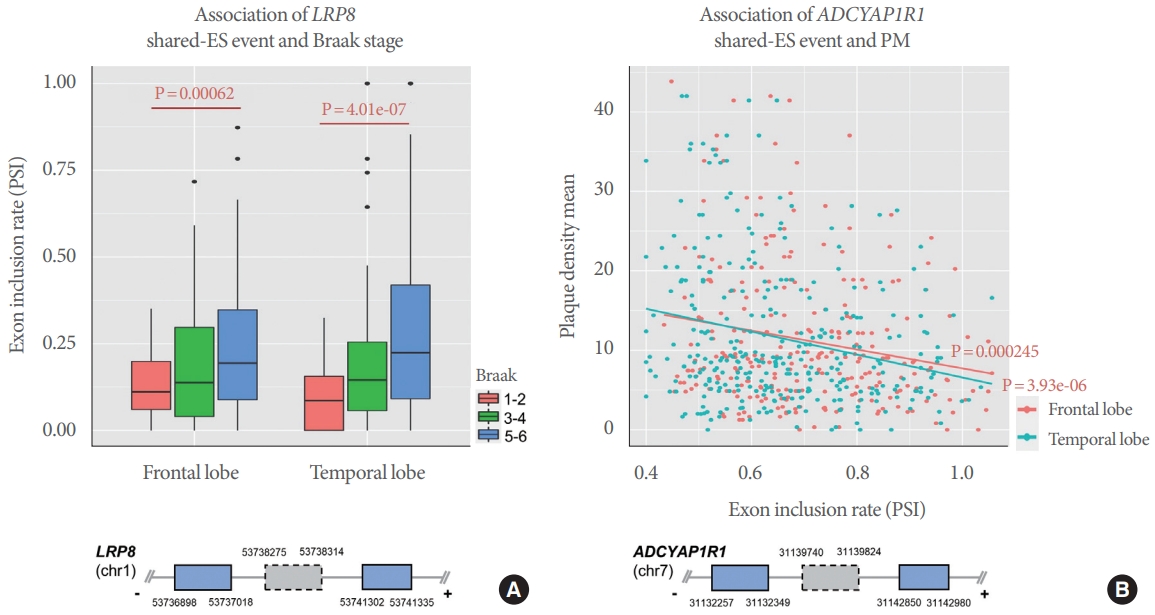
We present here examples of ES events common to both regions: LRP8 and ADCYAP1R1 (Fig. 4). As shown in Fig. 4A, inclusion of the LRP8 ES exon (chr1:53738275-53738314) is positively associated with Braak stage in both frontal (P = 0.00062) and temporal (P=4.01e-07) regions. That is, patients with high Braak stage tend to have increased PSI level (Fig. 4A). Similarly, PSI level of the ADCYAP1R1 ES exon (chr7: 31139740-31139824) is positively correlated with PM measurements in both frontal (P=0.000245) and temporal (P=3.93e06) regions (Fig. 4B). Therefore, these are examples of ES regulation common to both brain regions for these 2 neurological features in AD.
Braak- and PM-Associated ES Exons Unique to Frontal or Temporal Regions
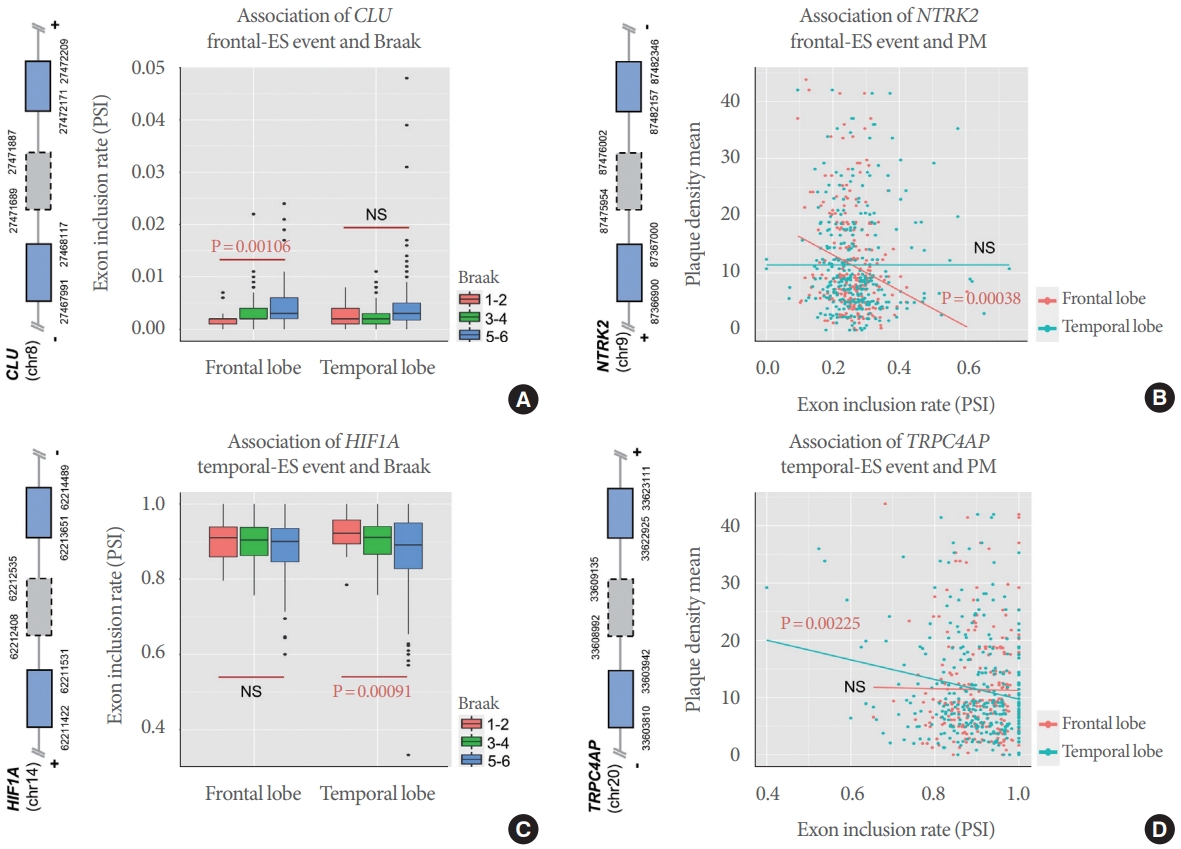
In addition to shared-ES regulation, we identified ES exons that have brain region-specific association with AD pathological features. For example, the CLU ES exon (chr8:27471689-27471887) showed a frontal-specific association with Braak stage, but no significant association in the temporal region (Fig. 5A). Similarly, the NTRK2 ES exon (chr9:87475954-87476002) was significantly associated with PM only in the frontal lobe, not in the temporal lobe. Conversely, 2 exons (chr14:62212408-62212535 and chr20:33608992-33609135 of HIF1A and TRPC4AP, respectively) were observed to have significant associations with Braak and PM, respectively, only in the temporal region.
A Comprehensive Case Study: APP
As a systematic case study, we selected the gene APP for functional analysis. In our protein interaction network (Fig. 3), APP appears as sort of a hub gene, hence its selection for further functional analysis to demonstrate its potential functional role and utility as a biomarker for AD.
APP has an ES exon (chr21:27354656-27354790) which encodes the important functional domain Kunitz_BPTI (Fig. 6). As shown in Fig. 6B, we observed significantly increased exon inclusion in both brain regions among patients with high Braak stage. Furthermore, PSI level of this exon is likely to have a significantly positive correlation with PM in both regions (Fig. 6C). In addition, we identified a sQTL (rs45475796; an intronic variant), a genetic variant that potentially regulates ES at this exon. The alternative allele, T, tends to increase PSI of the ES exon in brain regions. That is, the genotype at this SNP could inform the level of inclusion of the alternatively-spliced APP exon, and hence could be related to high Braak stage and increased PM in the AD brain (Fig. 6D). We further evaluated whether inclusion of this exon is consistently associated with disease status by comparing ES between AD and cognitively normal (CN, n=108 and 132 in frontal and temporal regions, respectively). We found this exon is differentially spliced between AD and CN individuals: specifically, it is more skipped in the CN group (Fig. 6E). This result suggests that this exon could be related to AD progression by linking PM and Braak staging measurements.
DISCUSSION
In this study, we explored brain-regional-based AS mechanisms associated with 2 important neurological features of AD, Braak stage and PM measurements, prioritizing 686 genes including CLU, PICALM, TREM2, APP, and ABCA7 that may contribute to AD risk, as indicated by GWASs. Although GWAS is a powerful tool that has successfully revealed an enormous number of trait-associated SNPs, the biologically implicated roles of those SNPs in certain traits have not yet been explained, which limits the utility of these associations in developing effective treatment strategies [32]. Transcriptomic analysis could allow us to gain insight into biological mechanisms at the mRNA level (e.g., gene expression and AS changes) [17]. Therefore, investigating AD-risk genes through integrative analysis of WGS, RNA-Seq, and clinical data may provide a useful resource for advancing our understanding of how genetic features induce AD risk.
Through gene set enrichment analysis, we identified enriched GO terms among ES genes observed in frontal, temporal, or both regions. For example, genes relating to axonogenesis were enriched among those with ES events in both regions. This functional gene set is critical for generating neurons in the brain [26]; therefore, although we studied only 2 brain regions here, this finding suggests that the identified AS event may play a significant role in AD-related neurodegeneration across the overall brain. In addition, we observed that the GO term “APP catabolic process” is enriched among frontal-ES genes. APP processing is one of the most critical mechanisms for AD pathologies. Sequential cleavage of APP contributes to generating the Aβ that is accumulated in the AD brain, and hence its dysregulation could lead to AD development and progression through abnormal Aβ burden [33]. Additionally, the term “neuron projection morphogenesis” was enriched among temporal-ES genes. Taken together, these results suggest that ES mechanisms in AD might affect different functional pathways depending on brain region, and prompts further study of particular brain regions depending on what mechanistic pathways are to be investigated. However, we note that we explored only a small gene set in this study (i.e., 686 AD-risk genes), and therefore, further analysis of all genes in a genome-wide manner is required to confirm our GO analysis observations and to obtain more comprehensive results.
Brain functions are very complex and region-dependent, leading to regional-specific pathological outcomes in AD; consequently, a brain region-based transcriptomic analysis has the benefit of elucidating a comprehensive molecular mechanism in the form of RNA regulatory mechanisms that underlie AD onset and progression [17]. Our study presented several ES exons and their relationships with AD pathological features in the RESULTS section.
The first was LDL receptor related protein 8 (LRP8), AS of which is associated with Braak stage in both regions. It is a member of the LDL receptor family and performs key functions in brain development by affecting synaptic plasticity, allowing lipoprotein trafficking, and promoting cell development [34]. Also, it is involved in APP processing and Aβ secretion, and hence plays a significant role in AD pathogenesis and neurodegeneration [34]. Notably, previous studies have demonstrated that LRP8 mRNA splicing alterations are correlated with AD progression through remodeling LRP8 functions [35]. For instance, in mice, decreased exon 19 splicing is observed in AD subjects [36]. The same study showed that use of an antisense oligonucleotide to correct the exon splicing could improve cognitive function, which suggests that dysregulation of the exon we found could be utilized as a treatment target for AD.
Another example is ADCYAP1R1, which is negatively correlated with PM. The alternatively- spliced exon of this gene encodes a functionally critical protein domain (pfam: 7tm_2; 7 transmembrane receptor family 2) that allows the protein to act as a G protein-coupled receptor in complex signaling. We found that decreased exon inclusion tends to increase PM measurements, which contribute to AD risk. That is, skipping of the exon might be involved in PM due to loss of ADCYAP1R1 function. In fact, deletion of this gene has been shown to cause neuron loss and axonopathy [37].
Thirdly, we presented frontal-specific (e.g., CLU and NTRK2) and temporal-specific (HIF1A and TRPC4AP) ES genes. Our previous study reported an AS exon of CLU that was observed to be differentially spliced between AD and control samples [5]. Another study has revealed that genetic variations of CLU have region-dependent effects on the gene’s expression [17]. In addition, CLU is associated with amyloid positron emission tomography imaging and hence Aβ deposition [4]. Therefore, AS mechanisms might be critical for CLU involvement in AD pathologies within the frontal brain region. NTRK2 was also shown to be negatively correlated with PM only in the frontal region, while the 2 temporal-specific ES genes, HIF1A and TRPC4AP, are associated with Braak and PM, respectively.
We next integrated WGS data to identify potential genetic regulators (SNPs) of the ES events identified through RNA-Seq analysis. This step was based on knowledge that SNPs referred to as cis-sQTLs can change splicing patterns by remodeling the binding affinity of splicing factors [5]. We found 418 SNPs that were associated with 44 ES events (44% of the total ES set). The remaining portion of ES events might instead be explained by trans-regulatory mechanisms (trans-sQTLs).
Finally, we presented a systematic relationship between ES and AD risk with a comprehensive case study of APP. This gene encodes the precursor of Aβ plaques and hence is among the most key factors for accumulation of Aβ [33]. Its dysregulation causes AD risk through Aβ deposition in the brain. Our results showed that inclusion of the 7th exon is elevated in both brain regions in patients with high Braak stage. Also, exon inclusion levels are positively correlated with PM in AD. Moreover, the ES exon encodes a functionally important domain (pfam: Kunitz_BPTI) that is involved in the APP protein cleavage process and hence plays a critical role in APP processing during AD progression [38]. Increased PSI indicates more activity of the functional domain. Further functional study of the increased cleavage activity stemming from increased inclusion of this domain and linking of the phenomenon to AD pathology are yet needed to gain a new understanding of the mechanism by which APP contributes to AD risk. We additionally identified a potential genetic regulator, rs45475796, for which the alternative allele, T, tends to increase inclusion of APP exon 7. This finding may provide a functional role of the SNP, as the sQTLs increase exon inclusion. In fact, this rs45475796 is in the linkage disequilibrium relationship with a known AD-associated SNP, rs117650267 (r2=0.45 and D’=0.88) [39]. Thus, further analysis of this SNP is merited to identify whether it can serve as an additional genetic marker for AD. Finally, we evaluated whether PSI levels of APP exon 7 could be used as a potential biomarker by comparing AD and CN groups. We found that this exon is differentially spliced between the groups (increased PSI in AD compared to CN), providing a resource for potential development of a candidate treatment target and a biomarker for AD. Indeed, increased APP expression in a mouse model causes neuron degeneration [40]. However, we note that part of our results concerning APP did not achieve significance according to our criteria (FDR<0.05): namely, PSI-PM association in the temporal region (P=0.00416) and ES-SNP association in the temporal region (P=0.027). Further analysis is required to replicate these results. Nonetheless, this case study demonstrates how APP could contribute to AD risk at a systematic and comprehensive level.
There are also general limitations of this study. First, we analyzed a relatively small number of samples, which can only explain a part of the AS mechanisms underlying AD risk. Second, we focused on previously implicated AD-risk genes, which may contribute to the lack of strong signal in the gene set enrichment analysis and may impede the identification of additional novel AD-risk AS mechanisms. Most of all, our results are required further study for an experimental validation or a replication from independent cohort data. However, the results from our integrative analysis of WGS, RNA-Seq, and clinical data illustrate how AD-risk genes can contribute to AD risk and pathologies in a brain region-dependent manner through AS mechanisms and their genetic regulators.
In conclusion, our study enables us to gain a new brain region-dependent mechanistic perspective and identify molecular mechanisms that operate via AS regulation of AD-risk genes that may be key factors for AD pathologies, ultimately providing a useful resource for identifying region-specific treatment targets and biomarkers for AD.