


INTRODUCTION
Sophisticated urodynamic investigations evaluate the functionality of the lower urinary tract (LUT) based on bladder filling and emptying processes. Urodynamic assessments aim to determine the activity of the detrusor muscle and dysfunction in voiding and are employed to monitor the progression of a disease or the efficacy of a therapy, or in cases of treatment failure. This specialized assessment, therefore, represents an attempt to reproduce the symptoms reported by the patient and to correlate them with the urodynamic data. The main clinical investigations typically consist of uroflowmetry and a pressure-flow study [1]. The latter is an analysis that could allow the identification of bladder outlet obstruction (BOO) or detrusor underactivity (DU). A pressure-flow study requires the use of a urethral catheter and a rectal probe to measure intravesical and intra-abdominal pressures, respectively [2,3]. The use of the urethral catheter and the rectal probe determines the degree of invasiveness of the procedure.
Nevertheless, to date, invasive pressure-flow studies remain the gold standard for measuring the detrusor pressure and for diagnosing BOO and DU, although the introduction of the catheter is associated with patient discomfort and can also cause other consequences [4,5], because it establishes a non-physiological condition that may change urination dynamics. Several studies in both men and women have shown alterations of urodynamic parameters (flow rate and detrusor pressure) [6,7] that may even affect diagnostic accuracy [8].
Currently, a noninvasive, reliable, and scientifically recognized system to determine detrusor pressure, DU, or BOO is unavailable [9–11].
The invasiveness of this procedure results from the need to measure the detrusor pressure through the catheter and the abdominal pressure through a rectal probe. This gives rise to the question of whether it is possible to remove the invasiveness from current urodynamic analyses. Some authors have proposed using jet exit flow velocity [12] or the outer shape of the urine stream [13] to avoid using the catheter, which is recognized to be the major source of discomfort.
Through an extended experimental activity, Lotti [14] proposed a noninvasive approach based on the simultaneous measurement of flow rate and jet exit velocity.
Building upon those results, this paper presents a velocity-based approach to formulate a new method showing the importance of jet exit velocity to assess the functionality of the male LUT during emptying. In order to validate this idea, the data collected by Lotti [14] on jet exit velocity were successfully compared with data published by Gleason et al. [12] and Griffiths [15].
MATERIALS AND METHODS
Experimental Activities
Extended laboratory activities have been carried out by Lotti [14], aiming to simulate the basic physical processes occurring during the emptying phase of the male LUT. A specific experimental apparatus has been designed to reproduce the hydraulic mechanism of urine flow through the urethra. This physical model has been used to carry out a wide range of experiments in order to investigate healthy, BOO, and DU conditions.
The physical model of the LUT consists of a pressure feed tank (simulating the bladder) connected to an elastic collapsible latex tube (urethra). This model, despite being a simplified reproduction of the LUT, has been successfully validated through a comparison between experimental results and data in the literature [15,16].
The model (Fig. 1), assembled and set up in the Bio-fluid-dynamic Laboratory of Department of Civil and Environmental Engineering of the university of our city, consists of a 2-m-tall cylindrical Plexiglas tank filled with water to reproduce human bladder pressure. At the bottom, a hole for drainage is connected to a collapsible elastic latex Penrose drain-type tube (urethra; hereinafter, “tube”). The tube has an internal diameter of 6 mm at rest and is 20 cm long, which is equivalent to the average male urethra. The tube is collapsible because, like the human urethra, the walls are not stiff enough to support themselves without internal pressure.
The tube is placed between 2 foam blocks subject to compression by means of an appropriate weight of a steel plate placed on the upper side of the foam (Fig. 2), thus simulating the external average compression of 10 cm H2O on the urethra due to the adjacent internal organs [17]. In this way, only the normal component of the stress acting on the tube wall is reproduced. The shear stress component that may be present in the human urethra is assumed to be negligible.
The experimental tests were directed at measuring the main variables of the system during the emptying of the water tank under different hydraulic conditions simulating several health statuses of the LUT, including BOO and DU.
The water level in the tank, expressed in terms of centimeters of water column (cm H2O), represents the pressure at the upstream end of the elastic tube, thus simulating the bladder pressure (P0) (Fig. 1). This value is intended to include detrusor and abdominal pressure.
Laboratory Tests
Laboratory tests simulated the hydraulic behavior of the system under different conditions of pressure and flow rate. The tank was emptied in such a way as to obtain values of P0 ranging between 20 and 150 cm H2O, the common range ordinarily found in the bladder. Each test was repeated 10 times; the maximum measured discrepancy was observed to be in the order of 6%.
Laboratory tests were carried out to investigate the emptying process of the tank by monitoring the physical parameters of the system under the conditions of water temperature (T) of between 20°C and 25°C, density (ρ) of 1,000 kg/m3, and kinematic viscosity (ν) of 10−6 m2/sec. The data acquisition frequency was 12.5 Hz under quasi-steady flow conditions.
Urethra strictures (BOO) were simulated by introducing hollow metal cylinders of various lengths and internal diameters inside the tube; the cylinders had an external diameter equal to the 6-mm external diameter of the tube to reproduce a rigid flow section reduction. The condition of low pressure (P0) inside the tank was assumed to be representative of DU.
Measured Variables
The electronic instrumentation consisted of a pressure transducer and a digital camera connected to dedicated data acquisition hardware and software. The main physical parameters were the water tank level in terms of pressure (P0; cm H2O) (reproducing the bladder pressure in the human LUT), the flow rate (Q; mL/sec), and the jet exit velocity (ue; cm/sec).
During the emptying process, P0 was monitored by means of a pressure transducer placed on the bottom of the tank.
The flow rate (Q; mL/sec) was evaluated using the continuous recording of P0, allowing the computation of the volume change over time in the tank. Then, by applying the principle of mass conservation for each time step Δt=ti+1-ti [s] the flow rate at the ith instant (Qi) was calculated as:
where P0,i and P0,i+1 are the P0 values in 2 successive instants, and Ωt [cm2] is the tank cross-section.
Since the parabolic trajectory of a jet is uniquely associated with its exit velocity and angle, the jet exit velocity (ue) was measured through image acquisition and processing (Fig. 3).
The Importance of the Jet Exit Velocity
The jet exit velocity is a noninvasive urodynamic parameter proposed by Gleason et al. [12] and Lotti [14]. As graphically explained in Fig. 4, the jet exit velocity determines the parabolic trajectory and so the distance at which the urine jet hits the ground. In other words, it represents in some way “how far” the urine jet falls away from the human body. Fig. 4A represents a low exit velocity, with the urine stream falling near the feet, while in Fig. 4B, a high jet exit velocity propels the urine stream much farther. This phenomenon is related to the bladder pressure energy, which is transformed into kinetic energy. Hence, the jet exit velocity (ue) can be assumed as a useful indicator of LUT functionality.
This additional parameter is therefore suitable for inclusion in noninvasive urodynamic analysis. Analogously to pressure, the jet exit velocity can be expressed in terms of an equivalent column water height by introducing the associated kinetic energy (Ve; cm H2O):
RESULTS
In order to confirm the validity of the jet exit velocity as an additional noninvasive parameter in urodynamics, experimental results simulating the healthy male LUT were compared with data from the literature.
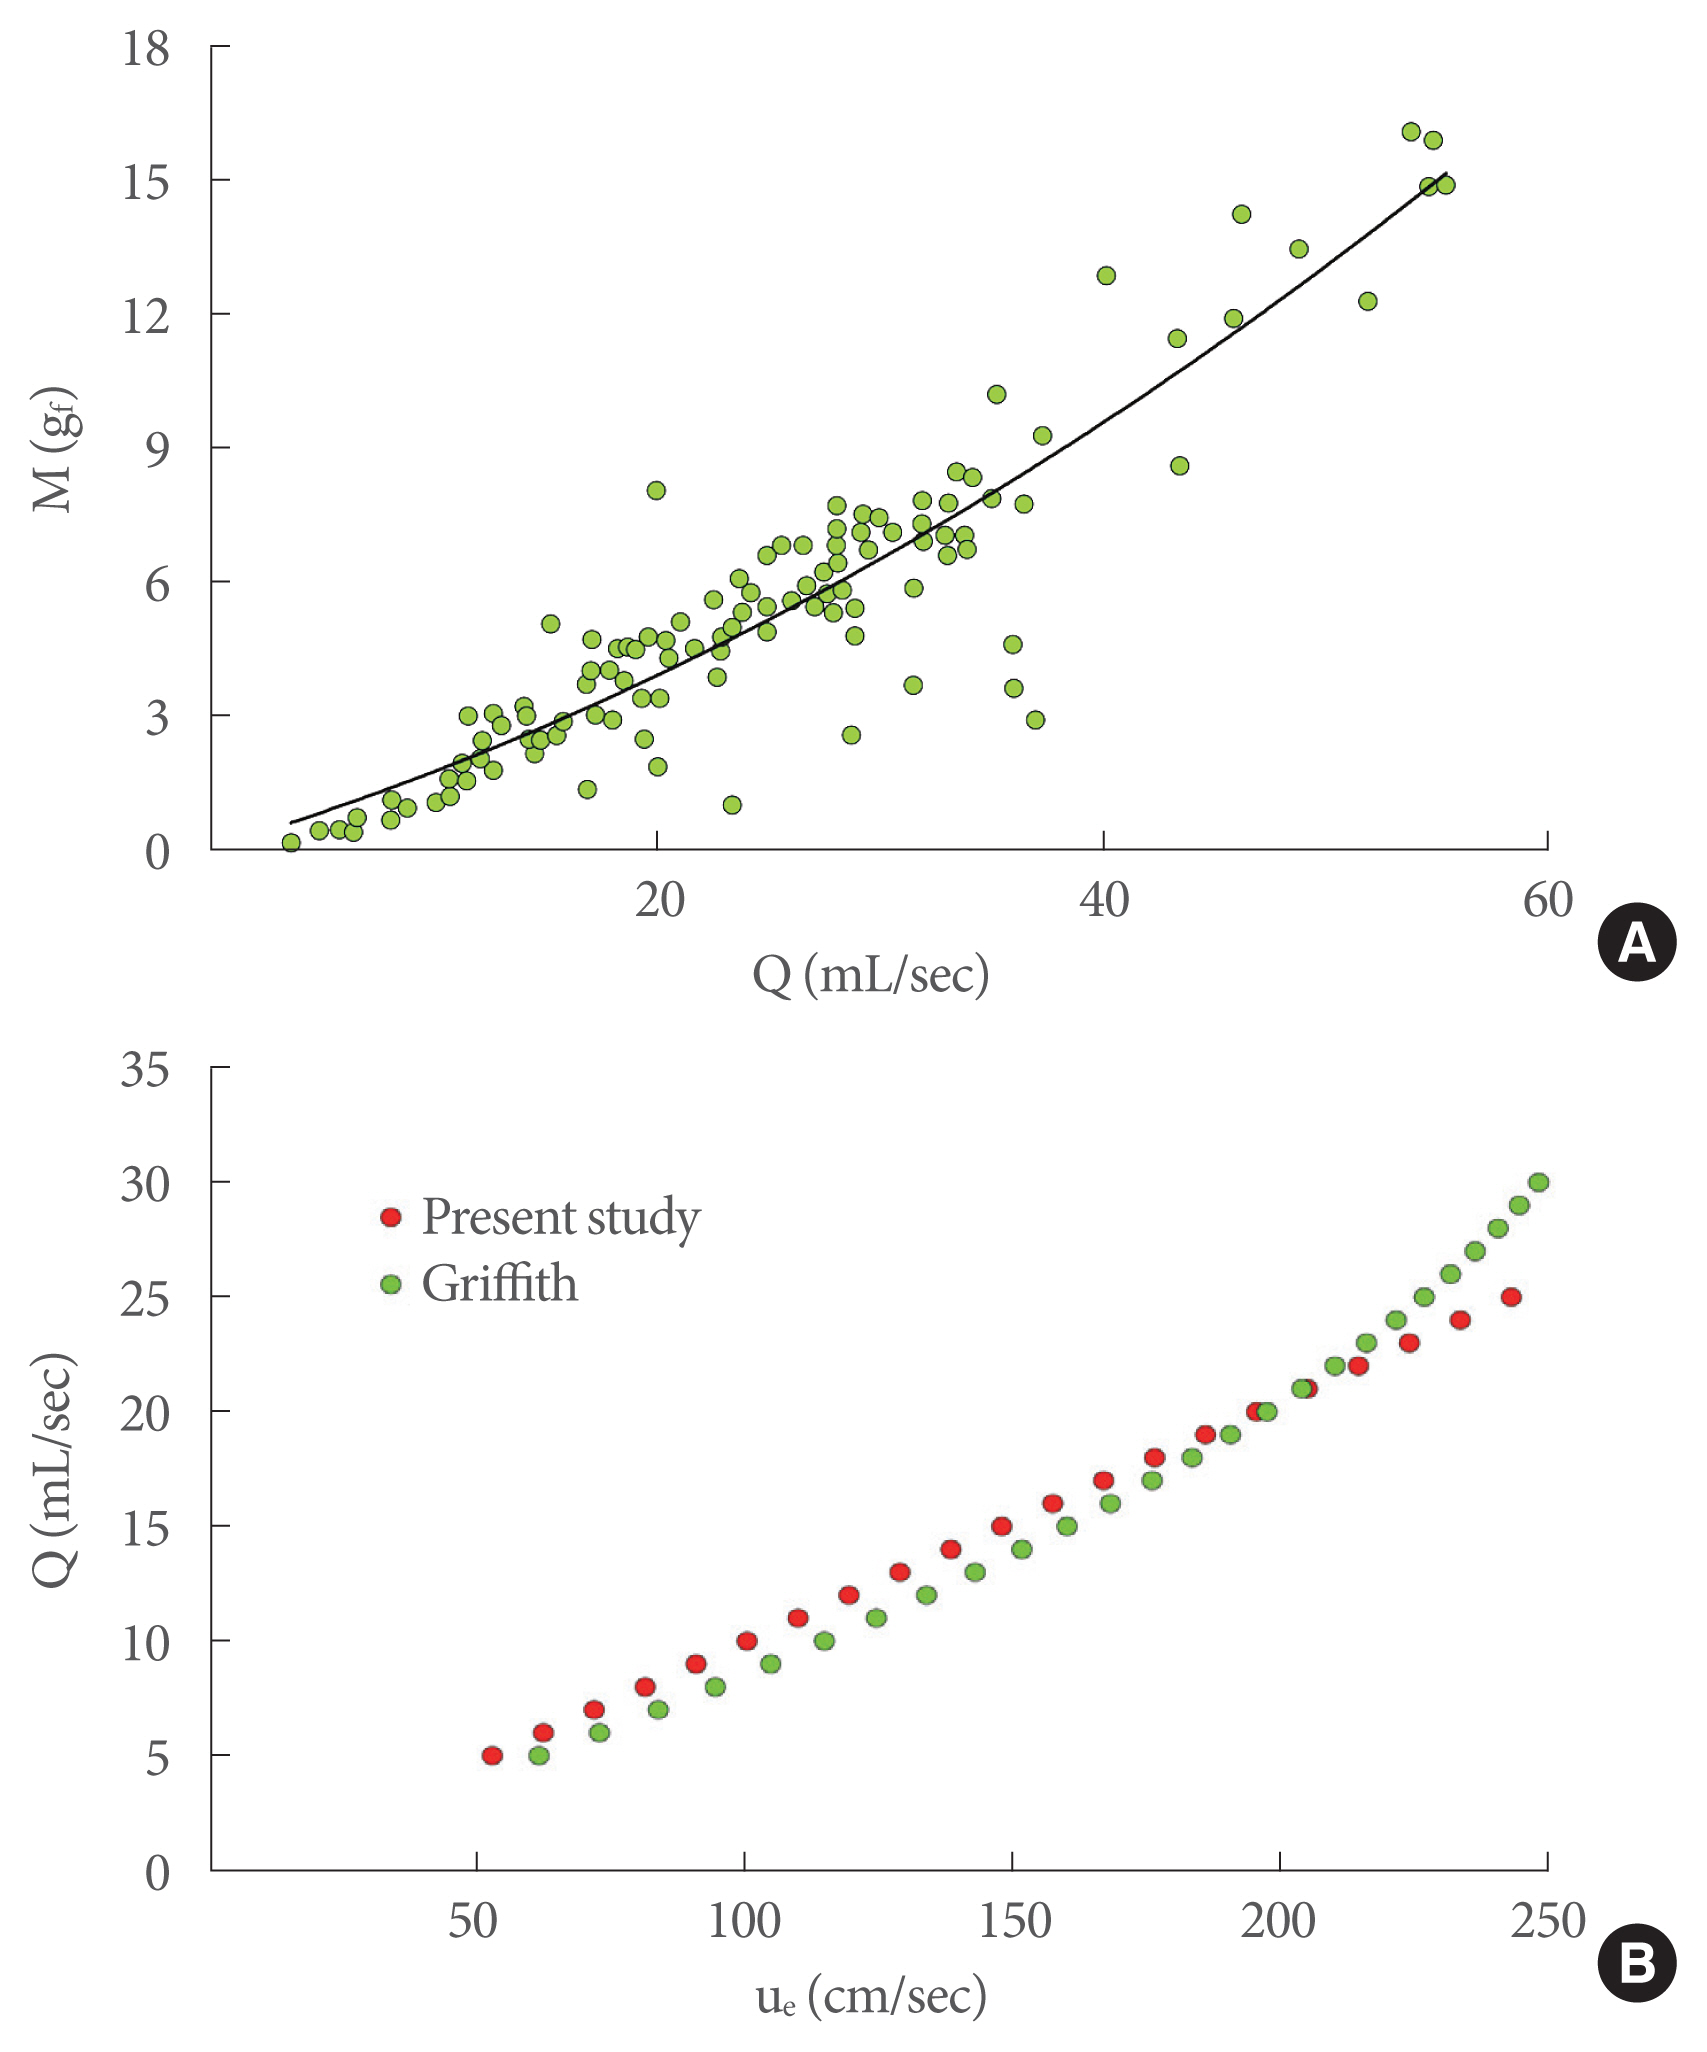
Griffiths [15] made the first contribution by relating the flow rate to the dynamic characteristics of the exit jet, expressed in terms of momentum (M=ρQue [gf]) (Fig. 5A), where ρ is the urine density (kg/m3) and Q is the peak flow rate (mL/sec). He experimentally obtained a diagram showing M as a function of Q from clinical trial measurements of healthy men. This diagram can be usefully converted in terms of Q-ue, since the M parameter is directly related to the jet exit velocity, by computing for each point of the diagram the value ue=M/ρQ and then fitting the obtained data (black line in Fig. 5A). In Fig. 5B, a comparison between ue in Griffiths’ data and ue obtained in the present experiments is shown. Very good agreement can be seen between our laboratory data and Griffiths’ measurements of healthy men.
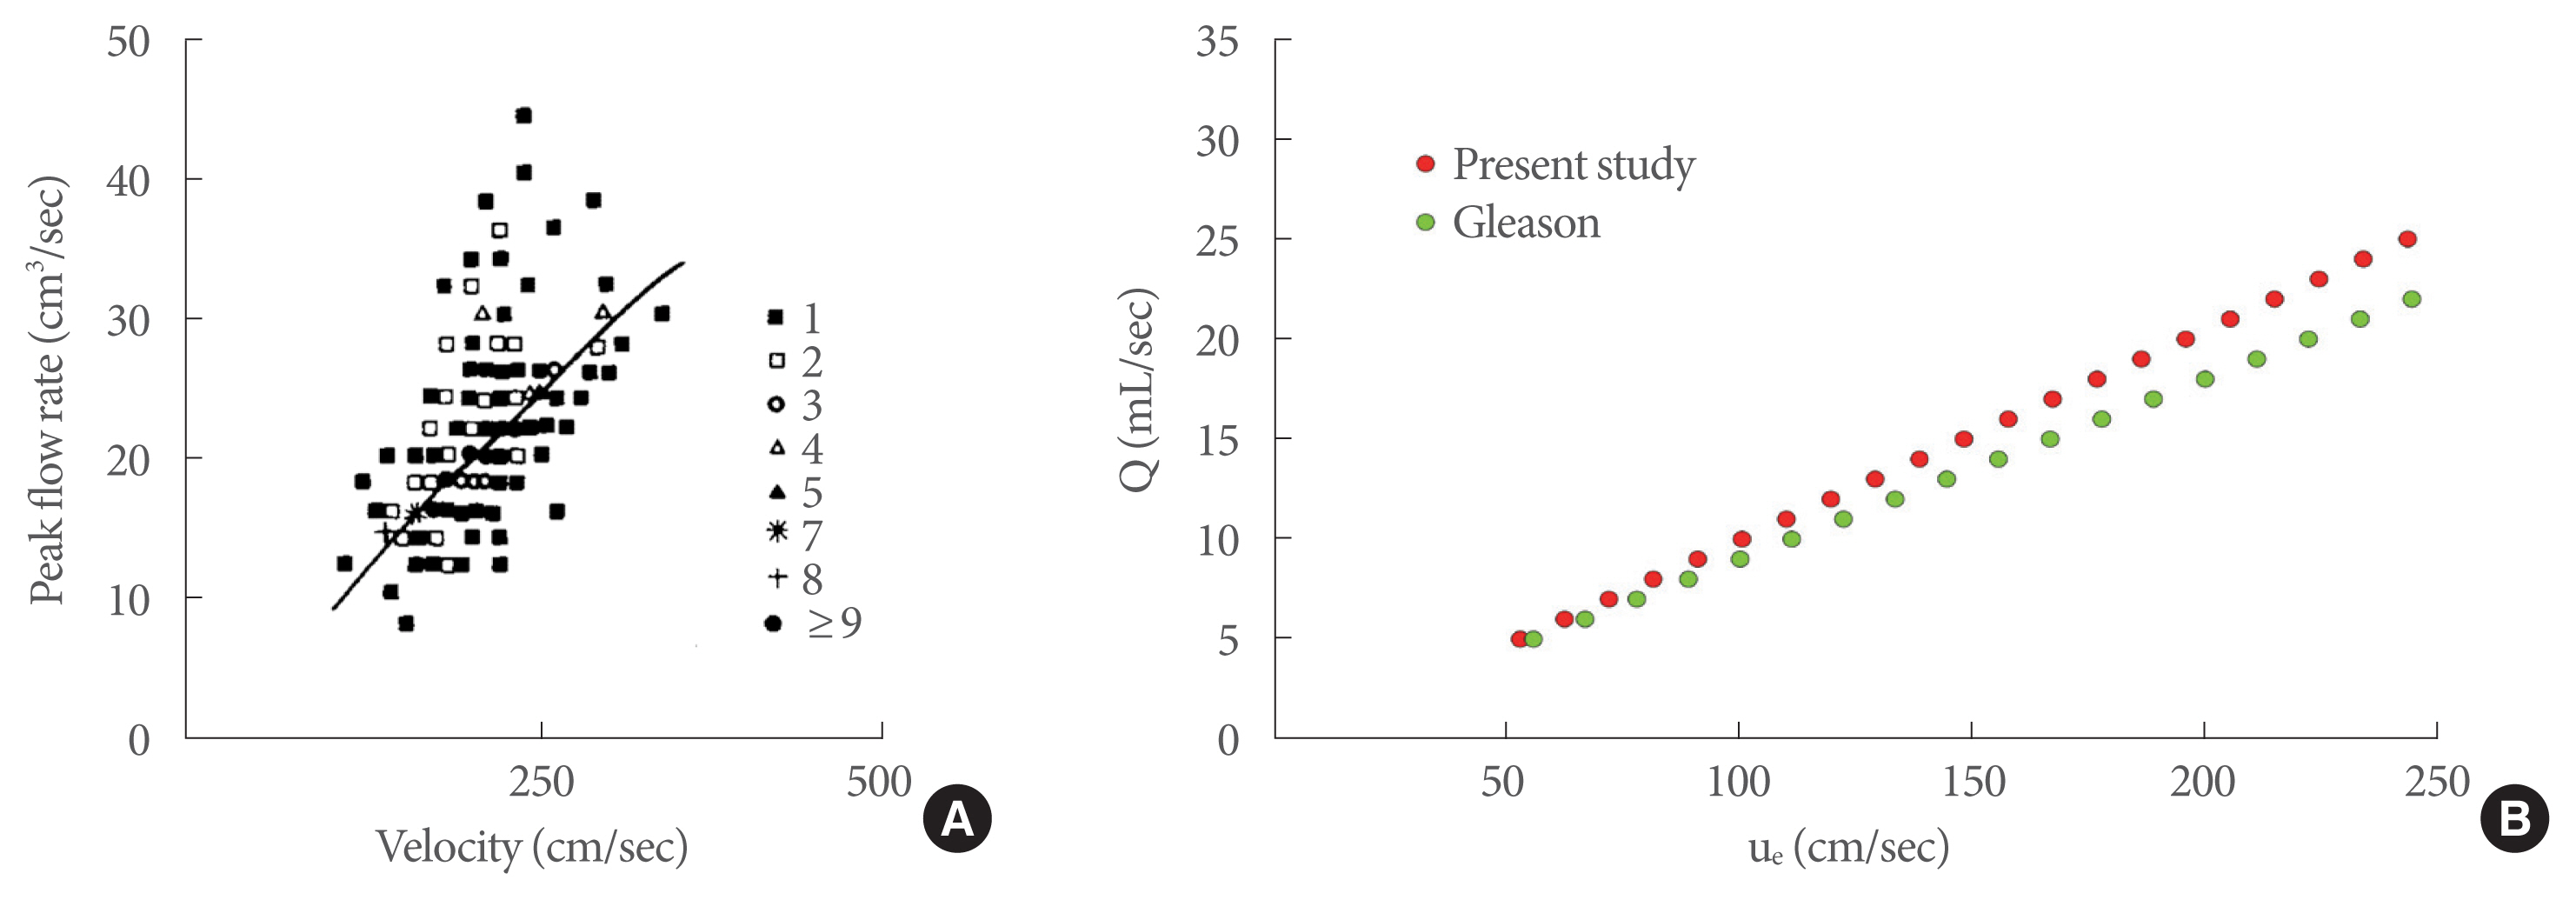
A further confirmation of the validity of our experimental data in adequately reproducing the healthy male LUT can be given by Gleason’s data [12]. Gleason investigated the jet exit velocity as an important parameter in noninvasive urodynamics, by carrying out clinical experiments in healthy men where peak flow rate and the corresponding peak jet exit velocity (ue) were measured. In Fig. 6A, a plot of Gleason’s trial data together with the best-fitting line is shown, while a comparison between Gleason’s data and our data is presented in Fig. 6B. The agreement between these 2 sets of data was also very good.
In order to show directly the agreement between the published and experimental data in terms of jet exit velocity, Fig. 7 shows the plot of ue as a function of Griffiths’ data (Fig. 7A) and Gleason’s data (Fig. 7B), where each point was obtained at the same peak flow rate.
Despite the complete independence of data sets used in this work, both in terms of the source of data and measurement procedures, the reliability of our experiments can be considered highly satisfactory, thus underscoring the importance of the proposed approach, which may offer an interesting perspective in noninvasive urodynamic analyses.
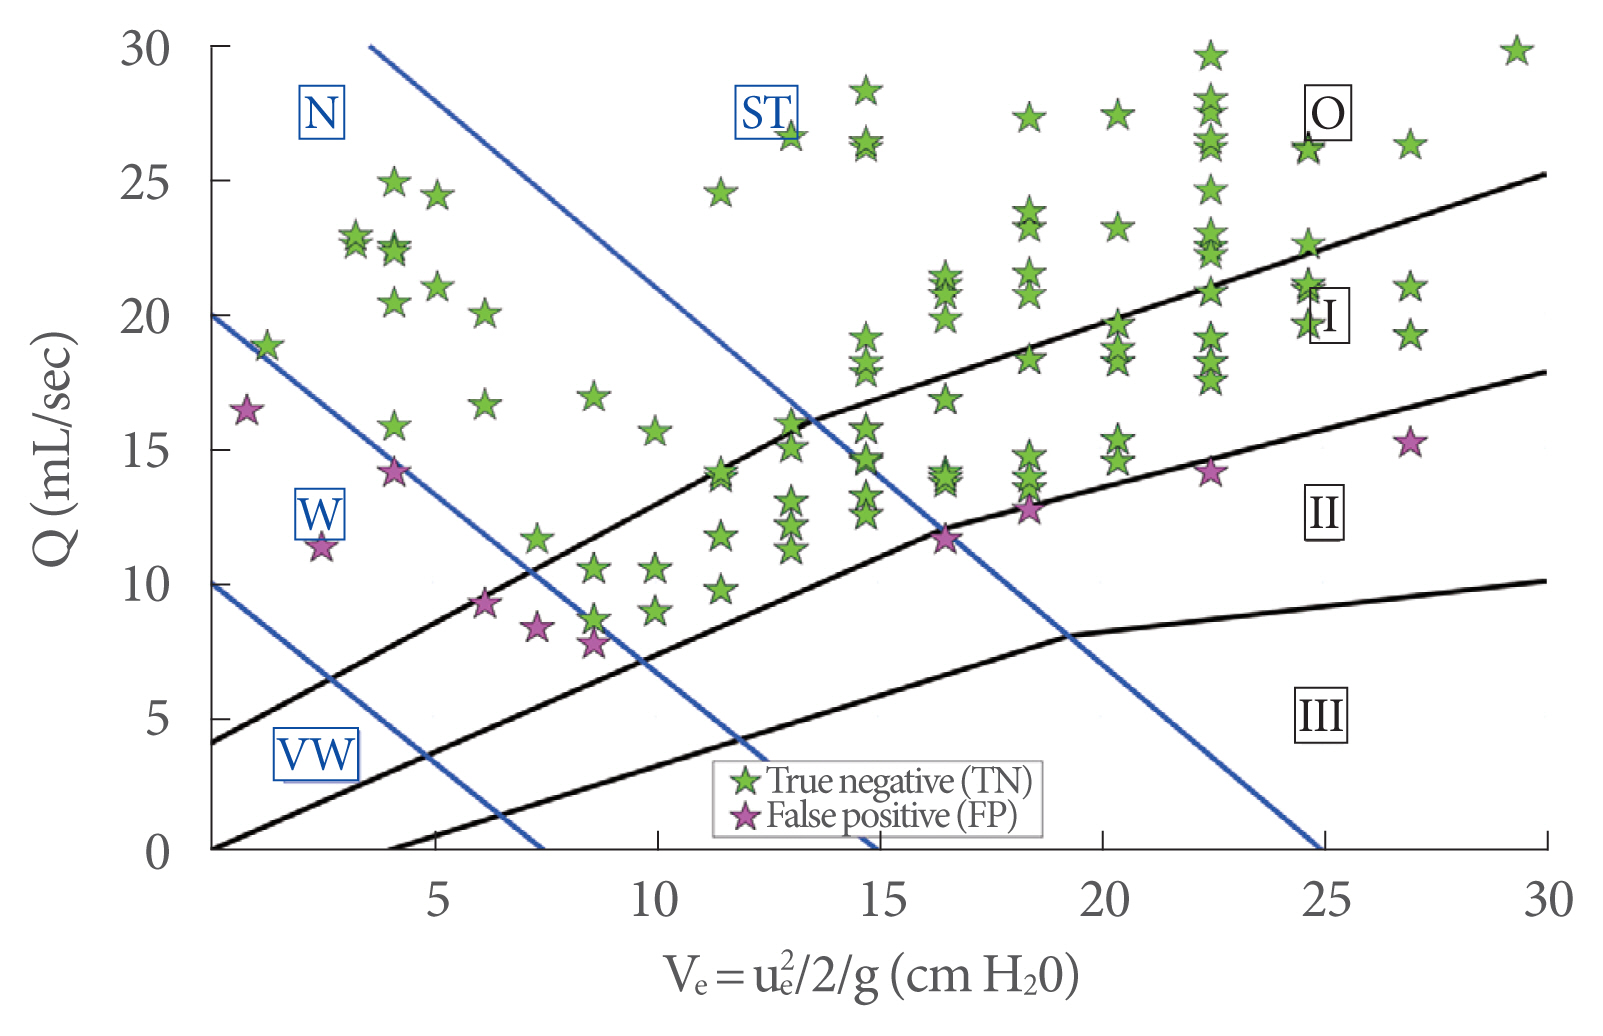
In order to show the usefulness of ue, the new diagram in Fig. 8 is proposed, where the peak flow rate (Q) is plotted against the kinetic energy (Ve) (Equation 2). Solid dots showing the experimental data are presented according to color and size depending on the BOO degree and detrusor strength, respectively. In particular, the dot size is inversely related to the detrusor strength, while colors refer to different levels of obstructions, as shown in legend of Fig. 8. Based on this classification, the plot area is partitioned by solid lines: black solid lines provide 4 subareas of BOO degree labeled with Roman numerals (0, I, II, and III), and blue solid lines provide 4 subareas of bladder contractility strength, corresponding to very weak (VW), weak (W), normal (N) and strong (ST).
The use of the proposed new diagram is analogous to the currently used diagrams in urodynamics (e.g., Schäfer, Abrams-Griffith): from the measurements of peak flow rate (Q) and the corresponding kinetic energy of the exit jet (Ve) the diagram allows the evaluation of the functionality of the LUT.
Fig. 9 shows the results of 117 clinical experiments, plotted on the new diagram, from healthy men collected in 2018 (Table 1). Very good agreement can be seen, since most of the clinical experiments lay correctly in the diagram region, where the obstruction grade was 0 or I and the detrusor strength was ST or N.
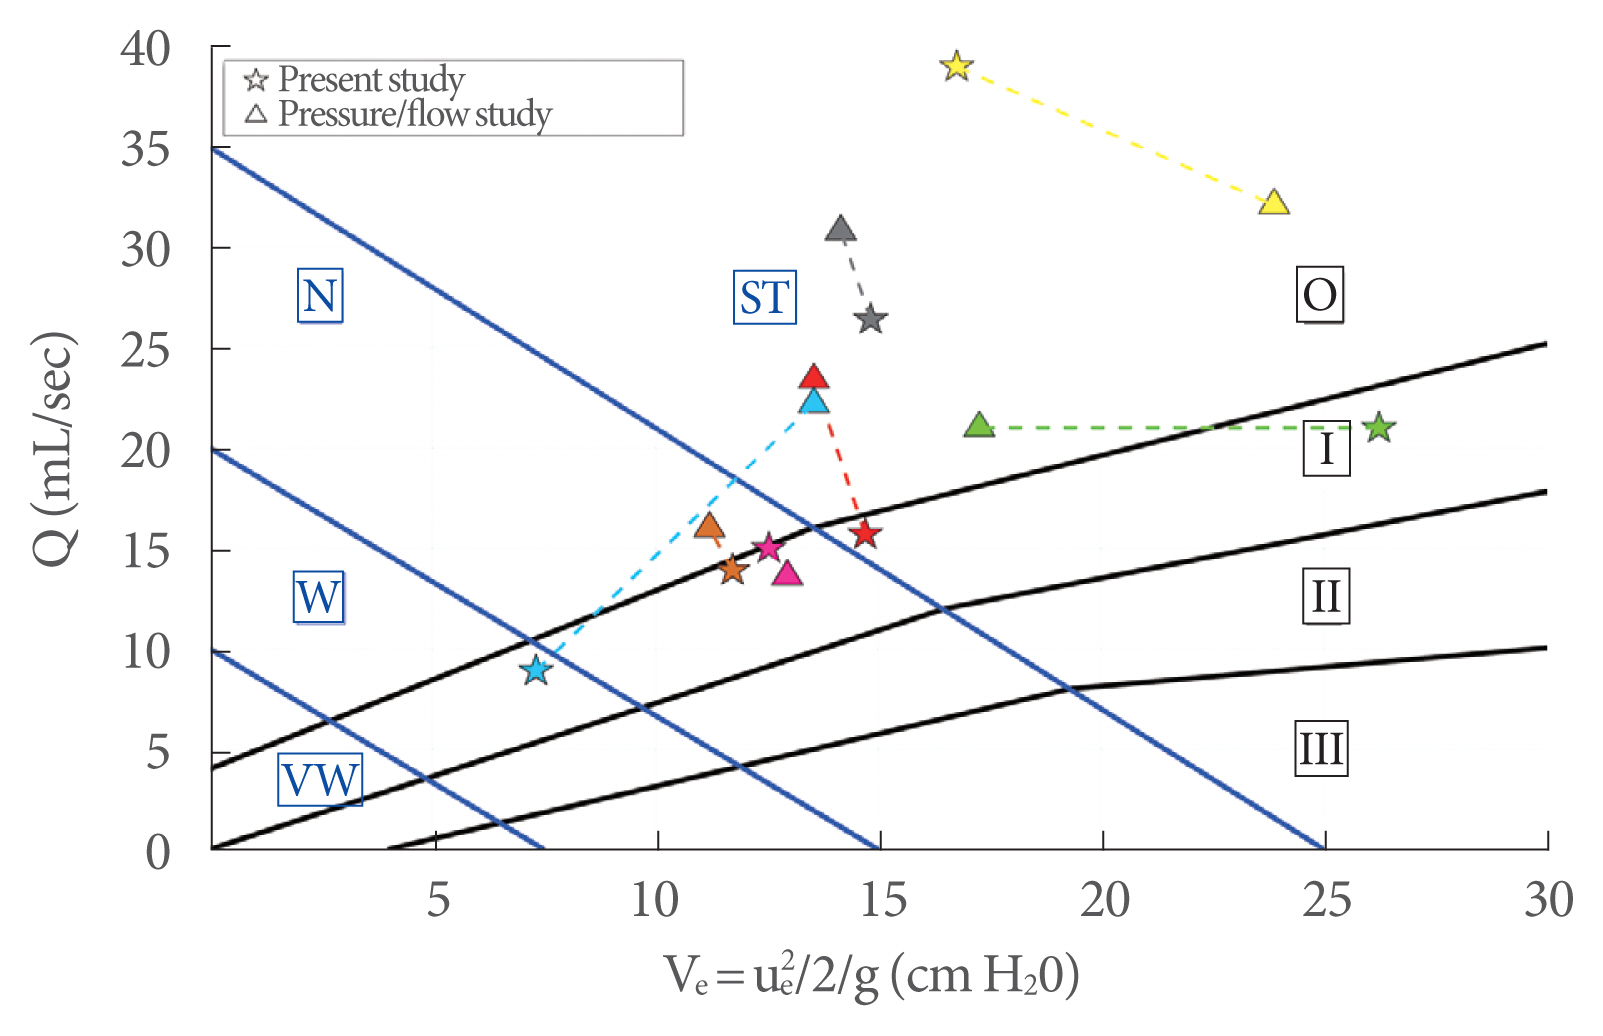
In Fig. 10, a comparison between the present study and a pressure-flow study in 7 healthy men is presented. The same color represents the same person. Despite the low number of available pressure-flow studies, it can be seen that most of the results were consistent, while only 1 (cyan) was a false positive.
DISCUSSION
The proposed method was calibrated using laboratory experiments obtained from a physical model of the male LUT. A preliminary assessment of its validity was conducted based on a comparison between experimental data and clinical experiments on healthy men from the literature, showing very good agreement and therefore confirming the important role played by the jet exit velocity in urodynamic studies.
Based on this large amount of experimental data, a new diagram, structured according to well-known diagrams commonly used in urodynamics (e.g., Schäfer and Abrams-Griffiths) has been proposed, allowing an assessment of the functionality of the LUT. The new diagram has been successfully tested using 117 clinical experiments from healthy men, obtaining a specificity of 91.5%. However, clinical experiments in men with BOO or DU are necessary to further verify the validity of this general approach as a noninvasive urodynamic study. The new diagram was also tested using available pressure-flow study data from 7 healthy men. Even if this number is insufficient to support statistically meaningful conclusions, the preliminary results are promising.
A further development of this research could be engineering a widely usable device based on the proposed approach. This would allow the progressive replacement of the current invasive technologies, thus reducing patients’ discomfort. Furthermore, the operating costs (in terms of materials and human resources) for the health facilities would be considerably reduced, allowing the prevention of diseases and management of citizens’ health at a larger scale.
The method proposed herein is valid only for males. Even if the basic principle of using the exit jet velocity in urodynamics is valid for all people, it is not possible to extend the proposed method based on image processing of an almost vertical jet for use in females. A different method of velocity measurement needs to be defined for the female LUT.
Furthermore, in the proposed method, the abdominal pressure was assumed to be negligible. If clinical tests reveal the relevance of abdominal pressure, this could be easily incorporated into the proposed methodology.