Men With Severe Lower Urinary Tract Symptoms Are at Increased Risk of Depression
Article information

Abstract
Purpose:
Lower urinary tract symptoms (LUTS) comprise a set of common, bothersome symptoms in middle-aged and elderly men. Recent research suggests that depressive symptoms may influence the symptoms of benign prostatic hyperplasia (BPH). We performed a community-based cross-sectional study to evaluate the correlation between LUTS and depression.
Methods:
The survey was conducted in a rural community during four periods in August 2009, 2010, 2011, and 2012. Two validated questionnaires were used to examine LUTS and depressive symptoms. These included the International Prostate Symptom Score/quality of life (IPSS/QoL) and the Korean version of the Center for Epidemiological Studies-Depression scale (CES-D-K). Patients were categorized in the depressive symptom group if their CES-D-K score was >16 points.
Results:
A total of 711 men were included in this study. Thirty-five participants (4.92%) were found to have depressive symptoms. There was a positive correlation between depressive symptoms and LUTS severity (P<0.001). As compared to the mild LUTS group, the odds ratio (OR) of depression was 2.868 (95% confidence interval [CI], 1.293–6.362; P for trend<0.001) in the moderate LUTS group, and 4.133 (95% CI, 1.510–11.313; P for trend<0.001) in the severe LUTS group. In a model considering multiple variables such as age, education level, smoking, and exercise, the OR in the moderate LUTS group was 2.534 (1.125–5.708, 95% CI, P for trend=0.005), while that in the severe LUTS group was 3.910 (95% CI, 5.708–11.154; P for trend=0.005). In addition, depression was related to voiding symptoms.
Conclusions:
Men with severe LUTS are at higher risk of depression than those with less severe urinary symptoms. The severity of voiding symptoms worsens depression. More aggressive urological diagnosis and treatment is needed in patients with severe LUTS, due to the impact on depressive symptoms and QoL.
INTRODUCTION
Depression is one of the most prevalent diseases worldwide, especially given its relationship with various chronic diseases. It is associated with an increased suicide rate, and is the cause of serious medical and social problems [1]. According to one Korean study, over the last 10 years, the lifetime prevalence of depression is 6.7% (men, 4.8%; women, 9.1%); this risk is increasing annually by 0.2% [2]. Depression has been associated with chronic diseases, including chronic obstructive pulmonary disease, inflammatory bowel disease, arthritis, diabetes, cancer, and myocardial infarction [3]. Lower urinary tract symptoms (LUTS) occur in >70% of men over 80 years of age [4]. Similarly, the prevalence of benign prostatic hyperplasia (BPH) is >80% in men 50–80 years old [5]. Therefore, a considerable number of elderly men with BPH also have LUTS. BPH is recognized as a primary cause of LUTS. One recent study clarified the risk factors for BPH and LUTS, including serum dihydrotestosterone, obesity, glucose homeostasis, diet, exercise, and inflammation [6-8].
Nocturia is one risk factor among LUTS for depression because it disturbs sleep at night [9,10]. There are both medical and surgical treatment options for BPH. Unfortunately, some BPH treatments may actually increase the risk of depression. For instance, 5-α reductase inhibitors may lead to erectile dysfunction [11]. Selective α1-adrenergic antagonists and transurethral resection of the prostate may result in retrograde ejaculation [12].
Several studies have recently reported that BPH and subsequent LUTS increase the incidence of depression and decrease the quality of life [13,14]. Based on these data, we performed a large, cross-sectional study to assess the relationship between BPH and depression.
MATERIAL AND METHODS
Patients and Study Design
This study was performed on a rural population (Yangpyeong, Gyeonggi-do) during August 2009, 2010, 2011, and 2012. The study included men over 40 years old. Multiple other parameters were analyzed, including education level, marital status, smoking, drinking, obesity (body mass index), regular exercise, and chronic disease (hypertension, diabetes). The correlation between depression and the degree of LUTS was investigated. In addition, during a live interview, participants completed a living habits-related questionnaire including demographic parameters.
All of the participants were instructed to complete the International Prostate Symptom Score/quality of life (IPSS/QoL) and Korean version of the Center for Epidemiological Studies-Depression (CES-D-K) Questionnaires for analysis of LUTS and depression.
The Institutional Review Board (IRB) of Hanyang University Guri Hospital reviewed and approved this study (2013-01-046).
Data Analysis
Patients were classified in the depressive symptom (DEP) group if their CES-D-K score exceeded 16 points.
The CES-D
The CES-D is a questionnaire that can be used to diagnose depression based on 20 items [15]. In this study, the questionnaire was translated into Korean. The DEPs were evaluated by each stage [16]. Measurements were performed by targeting test subjects with >16 points [17].
Statistical Analysis
The Cochran-Mantel-Haenszel test was used to analyze categorical variables. Independent t-tests and the general linear model were used to analyze continuous variables. In an analysis excluding age, P-value and P for trend correcting for age are presented. Logistic regression analysis was used to assess the correlation between LUTS and DEPs. The age correction model and multivariable model are presented. Variables that were correlated with LUTS were selected for calibration of the multivariable model. Statistical analyses were performed using two-way tests with α-error=0.05. Analyses were performed using the statistical package SAS 9.2 (SAS Institute Inc., Cary, NC, USA).
RESULTS
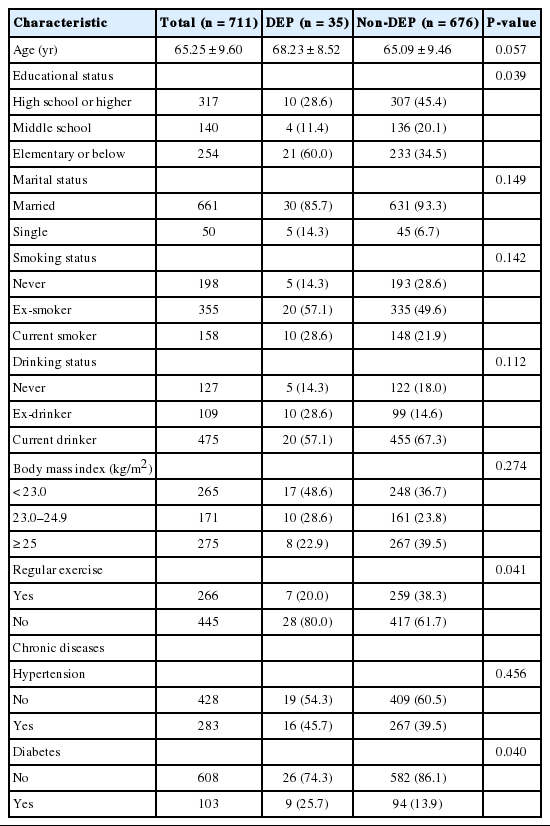
A total of 895 patients were initially included. Seven were excluded because they did not complete the questionnaire. In addition, 173 participants who did not complete the CES-D-K questionnaire and 4 who had missing informations in educational or marital status were excluded (Fig. 1). Ultimately, 711 men with an average age of 65.25±9.60 years were included in this study. Each participant was evaluated for age, education level, marital status, smoking, drinking, body mass index (kg/m2), regular exercise, and underlying diseases, including hypertension and diabetes. If participants scored >16 on the CES-D-K, they were classified in the DEP group (Table 1). A total of 35 (4.92%) were classified as having DEP. There was no significant age difference between the DEP and non-DEP groups (P=0.057). Demographic parameters and prevalence of obesity and chronic diseases (hypertension) were also not significantly different between the two groups.

Patient selection process. CES-D, Center for Epidemiological Studies-Depression scale.
Patient characteristics
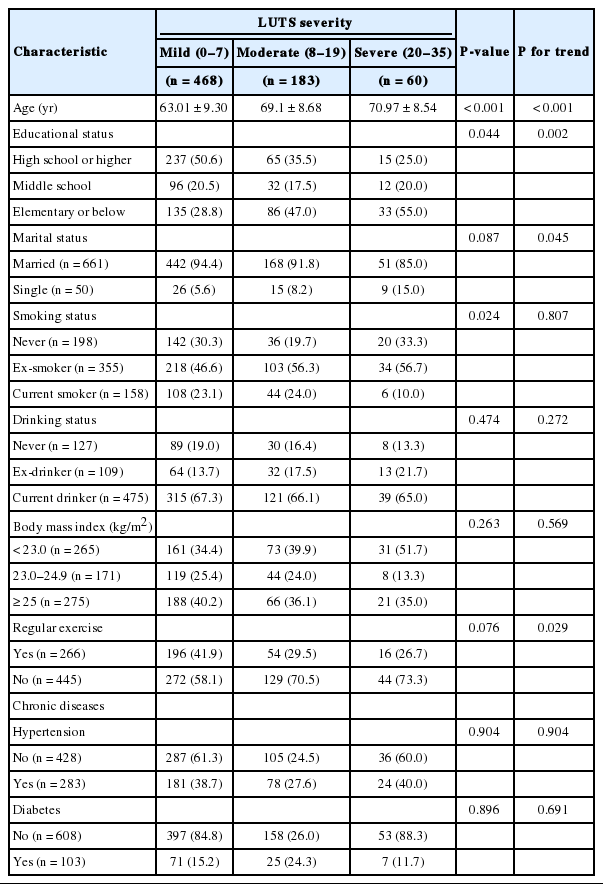
A total of 468 patients experienced mild symptoms (IPSS score, 0–7), 183 had moderate symptoms (IPSS score, 8–19), and 60 had severe symptoms (IPSS score, 20–35). Depending on the age, there were significant correlations (P<0.001) between LUTS and relevance of demographic parameter, obesity, exercise, chronic disease (hypertension, diabetes) was not represented statistically (Table 2).
Selected characteristics according to lower urinary tract symptom severity
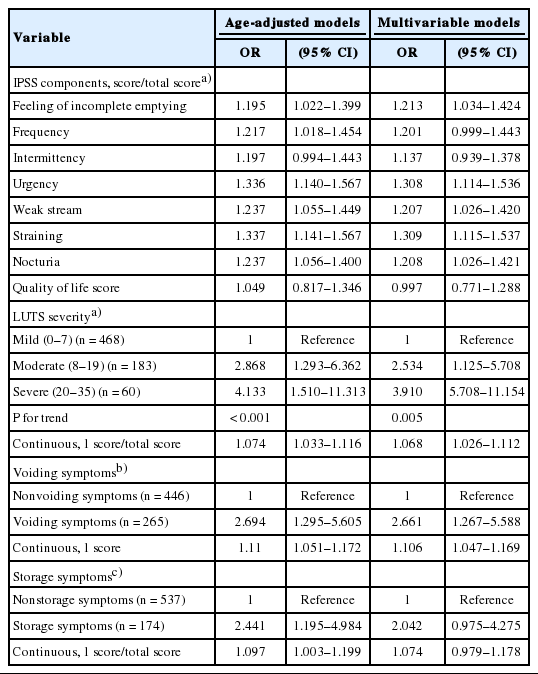
There was a significant positive correlation between the prevalence of DEP and LUTS severity. In a group with mild LUTS, the prevalence of depression was only 2.8%. With moderate LUTS, the prevalence was 8.2%, and in the severe LUTS group, it was 11.7% (P for trend<0.001) (Fig. 2). The odds ratio (OR) of depression in the moderate LUTS group was 2.868 (95% CI, 1.293–6.362; P for trend<0.001). In the severe LUTS group, the OR was 4.133 (95% CI, 1.510–11.313; P for trend<0.001). The correlation of each IPSS component with depression was also calculated. The following were calculated for each component: frequency OR, 1.217 (95% CI, 1.018–1.454); urgency OR, 1.336 (95% CI, 1.140–1.567); weak stream OR, 1.237 (95% CI, 1.055–1.449); straining OR, 1.337 (95% CI, 1.141–1.567); and nocturia OR, 1.237 (95% CI, 1.056–1.400). Voiding symptoms had an OR of 2.694 (95% CI, 1.295–5.605), and storage symptoms, 2.441 (95% CI, 1.195–4.984). In the multivariable model, which also considered age, education level, smoking, and exercise, the moderate LUTS group had an OR of 2.5344 (95% CI, 1.125–5.708; P for trend=0.005) and the severe LUTS group OR was 3.910 (95% CI, 5.708–11.154; P for trend=0.005). Each IPSS component was also calculated: frequency OR, 1.201 (95% CI, 0.999–1.443); urgency OR, 1.308 (95% CI, 1.114–1.536); weak stream OR, 1.207 (95% CI, 1.026–1.420); straining OR, 1.309 (95% CI, 1.115–1.537); and nocturia OR, 1.208 (95% CI, 1.026–1.421). Voiding symptoms had an OR of 2.661 (95% CI, 1.267–5.588), and storage symptoms 2.042 (95% CI, 0.975–4.275) (Table 3).
Prevalence of depressive symptoms according to lower urinary tract symptoms (LUTS) severity. Results are adjusted for age (categorical variable). P-values and P for trend were calculated using Cochran-Manel-Haenszel test for categorical variables. P=0.002, P for trend<0.001. DEP, depressive symptom.
Correlation between depressive symptoms and LUTS severity
DISCUSSION
This cohort study analyzed the association between LUTS and depression in men over 40 years old from a rural Korean community. As the severity of LUTS increased, the risk of depression also significantly increased.
Depression is one of the most common mental illnesses, and is increasing in prevalence. Given the correlation with suicide, this is a public health issue deserving of worldwide attention. A cross-sectional study of 229,595 adults in 2009 found that the prevalence of DEP and depression was 11.0% and 3.7%, respectively [18].
Urinary incontinence and overactive bladder are two urologic diseases that are relevant to depression. These two diseases are also closely related to age. These conditions also disturb sleep, which can affect quality of life for the patient and family members [19-21]. Our study also reveals that depression is not only related to LUTS severity, but also to age.
Several studies have demonstrated that LUTS relevant to BPH is closely related to age, depression, and quality of life. The relationship between LUTS and depression was not apparent in all cases [22]. Regardless, this correlation is clear. Quality of life decreases with increasing LUTS severity. Eckhard et al. [23] reported that quality of life worsens with increasing severity of urinary frequency and residual urine volume. In addition, LUTS not only affects quality of life for the patient, but also for family members. Gannon et al. [24] commented that older individuals suffering from prostatic disease have negative thoughts, in general. Men often have a sense of shame and anxiety stemming from their urologic diseases [25].
In a Taiwanese population, 2% of patients diagnosed with BPH developed depression; this risk was 1.87 times higher than that of people without BPH [26]. Johnson et al. [27] reported that the prevalence of depression increases as the severity of LUTS increases. Similarly, in our study, there was a positive correlation between LUTS severity and depression prevalence.
Nocturia causes insomnia, affects patients emotionally, and is directly related to depression [19,28]. One study found that frequent urination, weak stream, urgency, and nocturia all significantly affected depression [29]. Breyer et al. [30] performed a cross-sectional study in which 2,890 study participants were surveyed regarding the connection between depression and suicidal ideation depending on LUTS. Hesitancy, residual urine, and nocturia aggravated DEP. As the symptoms worsened, DEP similarly worsened. Nocturia has a close relationship with suicidal ideation. In this study, depression was associated with residual urine, weak stream, frequent urination, urgency, and nocturia. There were stronger relationships between depression and frequent urination, urgency, straining, weak stream, and nocturia. Storage and voiding symptoms were also related to depression. Voiding symptoms were more strongly correlated to depression than storage symptoms.
Pietrzyk et al. [31] reported that, in BPH patients, there are several elements that influence depression, including a sense of loneliness, cardiovascular disease, and severe LUTS. Wong et al. [32,33] found that in a Chinese population, loneliness, smoking, cardiovascular disease, corticosteroid use, and severe LUTS influenced depression development in BPH patients. In addition, the group found that as LUTS worsened, its correlation with DEP increased. Several studies have recognized the relationship between BPH and depression, and the severity of LUTS is an important element influencing depression.
This study is based on a local community population by a research institute so that consistent follow-up is possible. An additional study targeting the same cohort should be possible through ongoing follow-up. In addition, as an objective examination for BPH and depression is in progress, more information can be determined by comparing research and clinical findings based on objective indices.
This study has several limitations. For instance, we were not able to assess causality or the predictors relating LUTS and depression. In addition, this study was based on a small sample of patients. Our results probably cannot be generalized to the entire Korean male population. Future prospective studies may clarify the relationship and causality between LUTS and depression. These data would emphasize the importance of the correlation, and the need for screening and LUTS treatment.
In conclusion, men with severe LUTS have a higher risk of depression than do those with mild and moderate LUTS. The severity of voiding symptoms worsens the DEPs. Given its potential influence on depression and quality of life, there is a need for more aggressive urological diagnosis and treatment of LUTS.
Notes
Research Ethics
The Institutional Review Board of Hanyang University Guri Hospital reviewed and approved this study (2013-01-046).
Conflict of Interest
No potential conflict of interest relevant to this article was reported.