Comprehensive MicroRNAome Analysis of the Relationship Between Alzheimer Disease and Cancer in PSEN Double-Knockout Mice
Article information

Abstract
Purpose
Presenilins are functionally important components of γ-secretase, which cleaves a number of transmembrane proteins. Manipulations of PSEN1 and PSEN2 have been separately studied in Alzheimer disease (AD) and cancer because both involve substrates of γ-secretase. However, numerous clinical studies have reported an inverse correlation between AD and cancer. Interestingly, AD is a neurodegenerative disorder, whereas cancer is characterized by the proliferation of malignant cells. However, this inverse correlation in the PSEN double-knockout (PSEN dKO) mouse model of AD has been not elucidated, although doing so would shed light onto the relationship between AD and cancer.
Methods
To investigate the inverse relationship of AD and cancer under conditions of PSEN loss, we used the hippocampus of 7-month-old and 18-month-old PSEN dKO mice for a microRNA (miRNA) microarray analysis, and explored the tumorsuppressive or oncogenic role of differentially-expressed miRNAs.
Results
The total number of miRNAs that showed changes in expression level was greater at 18 months of age than at 7 months. Most of the putative target genes of the differentially-expressed miRNAs involved Cancer pathways.
Conclusions
Based on literature reviews, many of the miRNAs involved in Cancer pathways were found to be known tumorsuppressive miRNAs, and their target genes were known or putative oncogenes. In conclusion, the expression levels of known tumor-suppressive miRNAs increased at 7 and 18 months, in the PSEN dKO mouse model of AD, supporting the negative correlation between AD and cancer.
• HIGHLIGHTS
- Knockout of PSEN genes induces differential expression of miRNAs in the hippocampus.
- Differentially expressed miRNAs primarily target genes within cancer pathways.
- Role of miRNAs in cancer pathways as tumor suppressors supports negative correlation between Alzheimer disease and cancer.
INTRODUCTION
The enzyme γ-secretase is composed of 4 subunits: presenilins (PS), nicastrin, anterior pharynx defective 1, and PS enhancer 2 [1]. PS comprises the catalytic domain of γ-secretase, dysfunction in which has been directly linked to its ability to cleave type I transmembrane proteins, including substrates such as amyloid beta precursor protein, N-cadherin, Notch, and deleted in colorectal cancer [2]. Although various substrates are regulated by γ-secretase, 2 disorders—Alzheimer disease (AD) and cancer—have been reported as PS dysfunction–related disorders.
AD is a disorder associated with the malfunction of PS. Mice with mutations in either of the 2 PSEN genes did not show ideal AD phenotypes [3-5]. Conditional PSEN1 knock-out mice exhibited a number of pathological features, including subtle memory deficits without an increase in Aβ42 levels [3,4] and PSEN2 knockout mice did not show any hallmarks of AD [5, 6]. Nonetheless, the forebrain-specific PSEN double-knockout (PSEN dKO) mouse model displays both behavioral and pathological phenotypes of AD [6-8].
However, PS may also be involved in the pathogenesis of cancer. Notch, a substrate of γ-secretase, plays an oncogenic role in solid cancer types, including breast, colorectal, and pancreatic cancers [9]. As another substrate of γ-secretase, E-cadherin is also involved in tumor progression and metastasis [10]. Unsurprisingly, knockout of PSEN2 induces lung tumor development via increased Notch signaling [11], and the epidermis-specific double knockout of both PSEN genes has been reported to contribute to alterations of Notch expression and skin carcinogenesis [12]. However, conflicting with the above studies, the expression of PSEN1 was significantly upregulated in gastric cancer patients, which resulted in the increased translocation of cadherin into the nucleus [13]. Increasing evidence implicates PS in carcinogenesis. However, the role of PS in cancer still needs to be elucidated in double-knockout models.
Interestingly, an inverse correlation between AD and cancer has been suggested in numerous epidemiological and clinical studies. AD has been associated with a significantly reduced cancer incidence and vice versa [14,15]. Dysregulation of the cell cycle has been linked to both disorders, as apoptotic cell death is associated with AD, and cell proliferation with cancer. Notwithstanding the likely inverse relationship, few molecular mechanisms have been proposed.
MicroRNAs (miRNAs) are short noncoding RNAs that regulate gene expression at the posttranscriptional level by binding to the 3’-untranslated region of their target mRNAs, leading to their translational repression or degradation. A RNA-microarray study suggested that 52 tumor suppressor (TS) genes involved in phosphorylation, apoptosis, and the cell cycle were upregulated in early-stage AD patients [16], and another study reported that PSEN mutations increased the activity of the TS protein p53 in the brain of familial AD patients [17]. Nevertheless, most miRNA studies of both diseases have focused on finding diagnostic markers, rather than elucidating molecular mechanisms or new therapeutic targets. Herein, we performed a miRNA microarray study with PSEN dKO mice. By exploring the patterns of miRNA expression, we found a number of differentially-expressed miRNAs, and we performed a Kyoto Encyclopedia of Genes and Genomes (KEGG) pathway analysis of those miRNAs to explore the mechanisms underlying the inverse correlation between AD and cancer.
MATERIALS AND METHODS
Animals
We used male PSEN dKO mice with a partial deletion of PSEN1 in the forebrain and a complete knockout of PSEN2. The method of generating forebrain-specific conditional knockout has been specified in previous papers [6,7]. The wild-type (WT) and PSEN dKO mice were fed ad libitum, and 2–4 animals were housed in a cage under constant humidity (45%–55%), constant temperature (21˚C–23˚C), and a 12-hour light-dark cycle in a laboratory breeding room at the Korea Institute of Science and Technology.
Preparation of Microarray Samples and the Number of Animals
A total of 14 mice were used for the microarray analysis. Eight mice were WT and 6 were PSEN dKO, and for each age group (7 and 18 months), 8 and 6 tissue samples were analyzed using the microarray, respectively. Thus, the distribution of WT and PSEN dKO mice across their respective age groups was as follows: 4 WT mice aged 7 months, 4 WT mice aged 18 months, 4 PSEN dKO mice aged 7 months, and 2 PSEN dKO mice aged 18 months. Pairs of samples were pooled for the microarray analysis except the PSEN dKO mice aged 18 months.
RNA Preparation and Microarray Analysis
WT and PSEN dKO mice were sacrificed at the ages of 7 and 18 months. The complete mouse brain structure was removed and immediately prepared on dry ice. The hippocampus was dissected and stored at −80˚C until RNA isolation. Total RNA was isolated using the Trizol reagent. MiRNA expression profiling was performed using Affymetrix Gene Chip miRNA 4.0 arrays (Affymetrix, Santa Clara, CA, USA) containing 4,500 mouse mature miRNAs in the miRBase. However, only 146 hippocampal miRNAs, excluding miRNAs with raw data values below 100, were used for the heat map, target gene prediction, and KEGG pathway analysis. The heat map was visualized using the MultiExperiment Viewer (www.tm4.org). The microarray files can be accessed from the Dryad Digital Repository (https://doi.org/10.5061/dryad.9rv260r).
MiRNA Target Prediction and KEGG Pathway
We used TargetScan [18] and miRDB [19] to predict the putative targets of the miRNAs. Common genes selected from both databases were used as putative targets. In addition, genes targeted by 2 or more miRNAs were used for KEGG pathway analysis. The identified target genes were matched onto the functional annotation website DAVID 6.8 (Database for Annotation, Visualization and Integrated Discovery) [20, 21] (http://www.genome.ad.jp/kegg). For gene target matching on DAVID, selection criteria were determined by uploading the gene list using official gene symbols in DAVID, selecting Mus musculus as the species, and then selecting KEGG pathways with a cutoff of P<0.05 (http://www.genome.ad.jp/kegg).
RESULTS
Loss of the PSEN Genes Leads to Differential Expression of miRNAs in the Hippocampus
We used a total of 146 hippocampal miRNAs, excluding miRNAs with raw data values below 100 (Fig. 1), which were thought to be miRNAs with negligible endogenous expression levels. Normalization was performed with the miRNA expression levels of WT mice for each miRNA identified. The loss of the PSEN genes had a greater effect on the expression of miRNAs at 18 months of age than at 7 months (Fig. 2). The loss of the PSEN genes led to differential expression of 49 miRNAs within the hippocampal region at 7 months, and of 130 miRNAs at 18 months. Among the 49 miRNAs showing expression changes at 7 months, consistent expression changes were observed in 47 miRNAs, which were classified as 7+18-M miRNAs (Fig. 3A). However, the direction of the change in expression was not maintained in most of the 7+18-M miRNAs (Fig. 3A). Ten miRNAs showed increased expression levels and 2 miRNAs showed decreased expression levels at both ages. Interestingly, 83 miRNAs with no difference at 7 months were differentially expressed at 18 months (Fig. 3B). These 83 miRNAs were termed 18-M miRNAs (Fig. 3B).
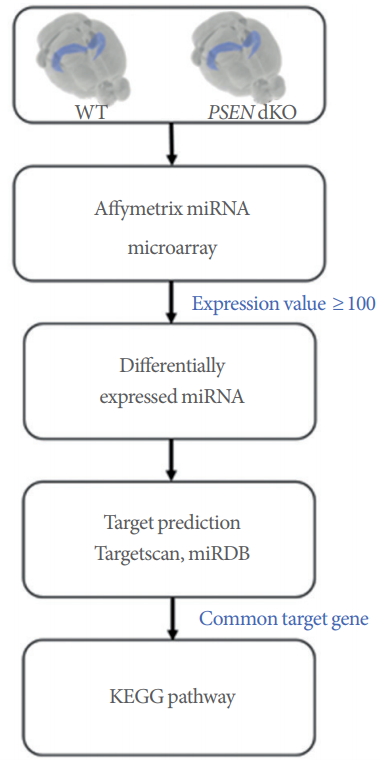
Schematic of the study procedure. The hippocampus of presenilin double-knockout (PSEN dKO) mice was analyzed using a microRNA (miRNA) microarray. MiRNA expression profiling was performed using Affymetrix Gene Chip miRNA 4.0 arrays. Only miRNAs with raw expression values of over 100 were used for the subsequent data analysis. Target gene prediction was performed using the TargetScan and miRDB websites. Genes that were targeted by 2 or more miRNAs were chosen for Kyoto Encyclopedia of Genes and Genomes (KEGG) pathway analysis.
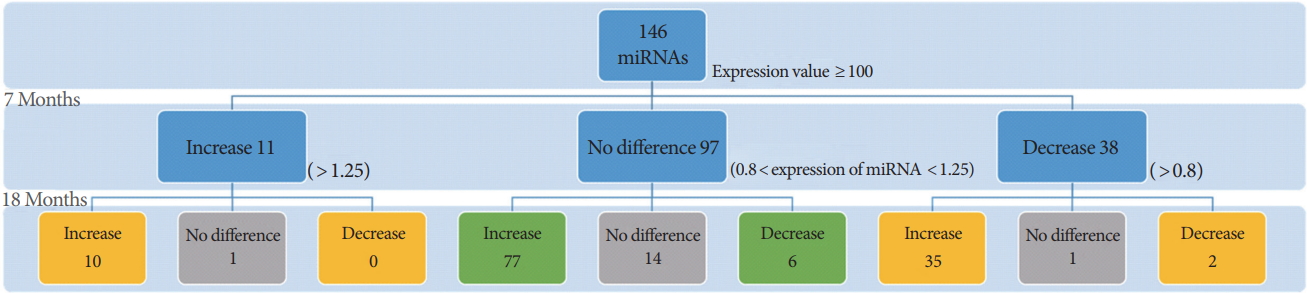
Sorting of differentially-expressed microRNAs (miRNAs) in 7-month-old and 18-month-old PSEN double-knockout (PSEN dKO) mice. A total of 146 miRNAs were analyzed for data processing after excluding the miRNAs with raw expressions of below 100. The second and third rows denote the number of differentially expressed miRNAs in the 7- and 18-month-old dKO mice compared to their agematched wild-type (WT) counterparts. The ratio of dKO mice to WT mice was converted to the log scale (log2) to denote fold change (increase/decrease). Log2-converted values greater than 1.25 were considered to show upregulated expression and those less than 0.8 were considered to show downregulated expression. Yellow boxes indicate the 7+18-M miRNAs group, Green boxes indicate the 18-M miRNAs group, and Gray boxes indicate the miRNAs excluded from further analysis due to the absence of a change in the expression levels.

Heat map of differentially-expressed microRNA (miRNA). A total of 130 miRNAs were judged to have been either upregulated or downregulated according to their ratios in age-matched double-knockout (dKO) and wild-type (WT) mice. Red denotes increased expression, and green denotes decreased expression. The log2-normalized fold change ratio was expressed with a range (min, -2.0; max, 2.0). (A) Increased or decreased miRNA expression at 7 months of age was also observed at 18 months of age in the 7+18-M miRNAs. (B) Some miRNAs that showed no change in expression compared to the WT mice at 7 months of age were observed to show increased or decreased expression in the 18-month-old mice (18-M miRNAs).
Differentially Expressed miRNAs Mainly Target Genes Within Cancer Pathways
To explore the role of the 7+18-M miRNAs and 18-M miRNAs, we investigated their putative targets based on the TargetScan and miRDB databases. Only genes targeted by 2 or more miRNAs were used for the KEGG pathway analysis to minimize false-positive matches. A total of 1,376 genes targeted by the 7+18-M miRNAs and 2,659 genes targeted by the 18-M miRNAs were used to identify the involved pathways (Fig. 4A, B). The genes targeted by the 7+18-M miRNAs and the genes targeted by the 18-M miRNAs showed involvement in various pathways such as pathways in cancer (cancer pathways), PI3KAkt signaling pathway, and Endocytosis (Fig. 4C). The pathways were ranked by the number of involved genes. Cancer pathways were the most common, with 54 and 102 genes among the total targeted genes of the 7+18-M miRNAs and 18-M miRNAs, respectively (Fig. 4C).
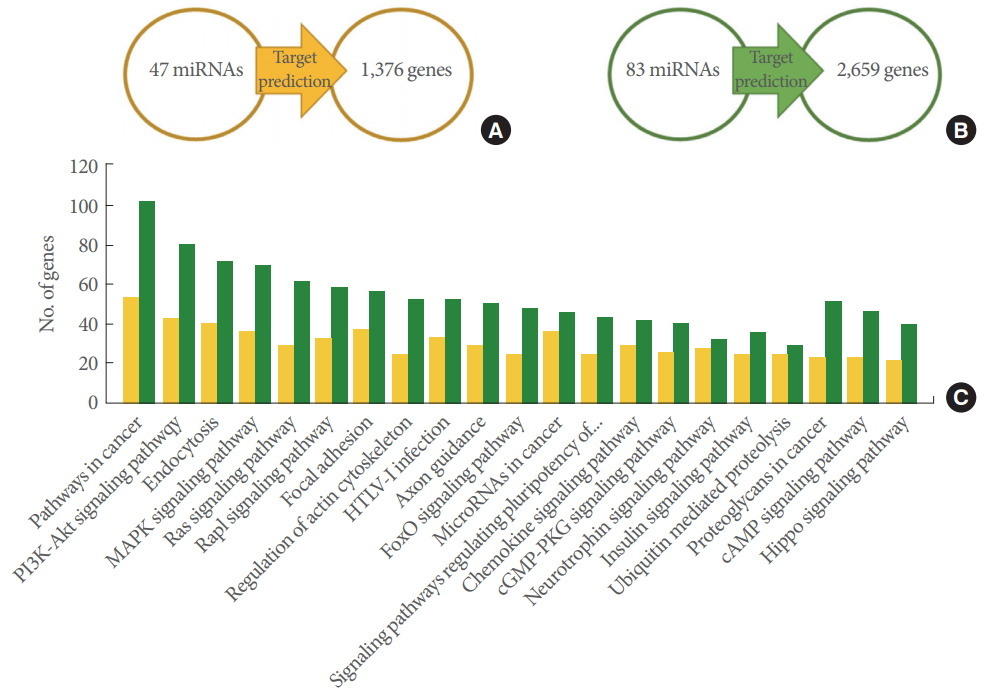
Target gene prediction and their KEGG pathways. (A) The 47 7+18-M microRNAs (miRNAs) were shown to target 1,376 genes. (B) The 83 18-M miRNAs were shown to target 2,659 genes. (A, B) Target genes predicted using TargetScan and miRDB. (C) The target genes and the pathways they participated in were determined using DAVID/KEGG pathway database analysis (P<0.05). The yellow bars indicate the putative pathways of the genes from (A), and the green bars indicate the pathways of the genes from (B). KEEG, Kyoto Encyclopedia of Genes and Genomes; DAVID, Database for Annotation, Visualization and Integrated Discovery.
MiRNAs in Cancer Pathways Target Oncogenes as TSs
The miRNAs in Cancer pathways are shown in Fig. 5. The selection criterion for the listed miRNAs was whether a miRNA targeted more than 4 genes. A literature search indicated that the 7+18-M miRNAs and 18-M miRNAs were either tumor-suppressive miRNAs (TS-miRNA) or oncogenic miRNAs (onco-miRNA). We searched the literature through PubMed and Google Scholar to determine whether each miRNA involved in the Cancer pathway was a TS-miRNA or an onco-miRNA. Only 4 of the 62 total miRNAs (miR-207, let-7a*miRNA-350, and miR-676) have not been reported to play a role in cancer (Fig. 5). As shown in Fig. 5A, all 7+18-M miRNAs involved in Cancer pathways showed increased expression levels. Furthermore, most of the 7+18-M miRNAs with increased expression (15 of 23) are known to be TS-miRNA. By type, breast cancer (9 of 23 miRNAs) and lung cancer (5 of 23 miRNA) were most frequently associated with the 7+18-M miRNAs overall, as well as with the TS 7+18-M miRNAs (Supplementary Table 1). As shown in Fig. 5B, all the 18-M miRNAs involved in Cancer pathways showed increased expression levels. Furthermore, more than half of the 39 miRNAs with increased expression (23 of 39) are known to be TSmiRNA. By type, breast cancer (11 of 39 miRNAs), lung cancer (11 of 39 miRNAs), and gastric cancer (9 of 39 miRNAs) were most frequently associated with 18-M miRNAs overall, as well as with the TS 18-M miRNAs (Supplementary Table 2).
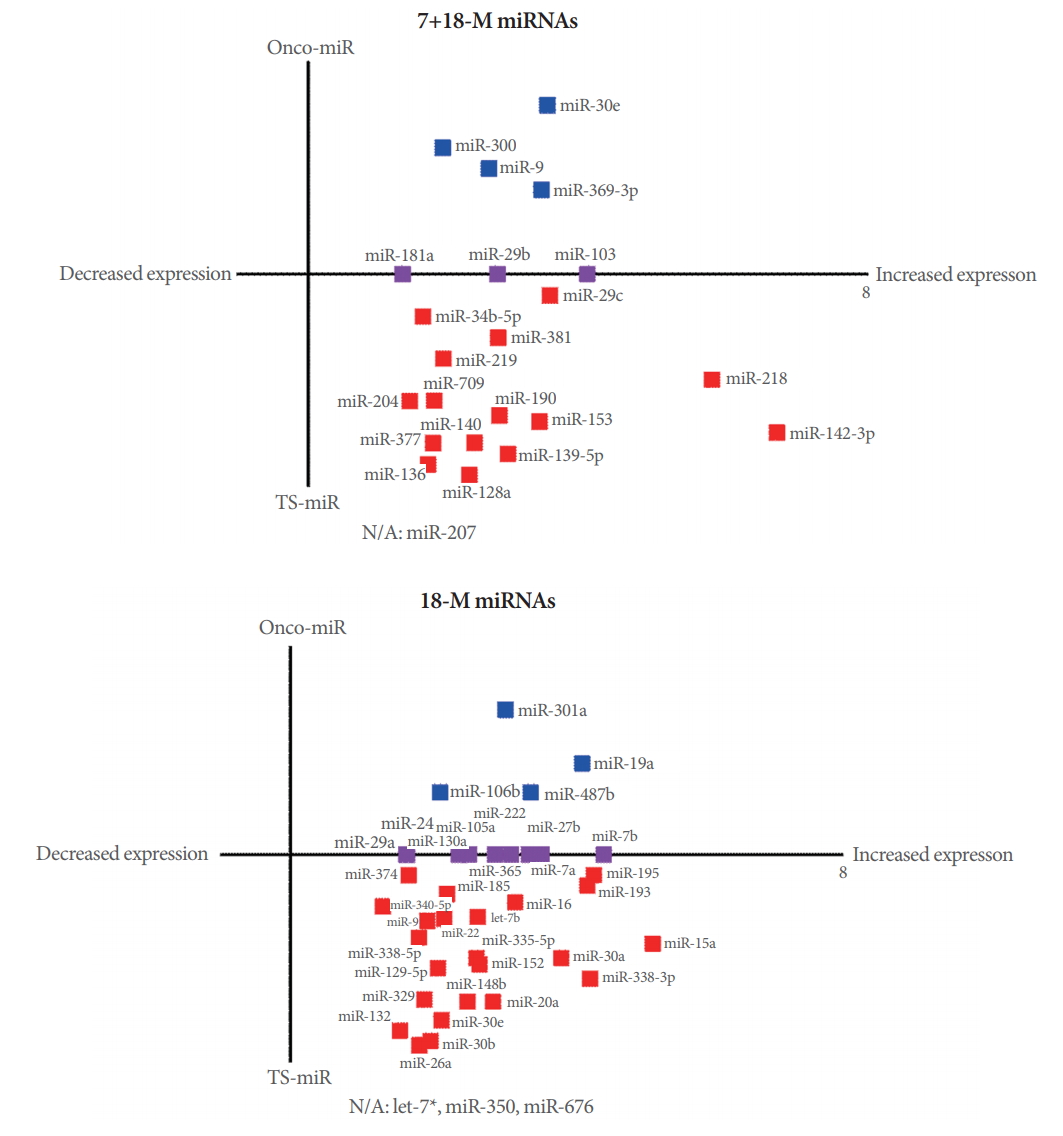
7+18-M microRNAs (miRNAs) and 18-M miRNAs related to cancer pathways. (A) 7+18-M miRNAs and (B) 18-M miRNAs involved in Cancer pathways. Red indicates tumor-suppressive miRNAs (TS-miRNA), blue indicates oncogenic miRNAs (oncomiRNA), and purple denotes oncogenic and tumor-suppressive miRNAs. The miRNAs with no report of involvement in cancer were denoted as N/A (not applicable).
DISCUSSION
This is the first study to investigate the relationship between AD and cancer by analyzing miRNA expression in a mouse model with significant AD-like pathology, PSEN dKO mice. In the present study, we profiled hippocampal miRNA expression in the PSEN dKO model relative to the WT group. By exploring the patterns of miRNA expression, we found that there were more differentially expressed miRNAs in the aged mice (18 months of age) than in the 7-month-old mice. In addition, we found that most of the hippocampal miRNAs were upregulated. Furthermore, the 7+18-M miRNAs and 18-M miRNAs, which showed altered expression levels, were found to be known TSmiRNA. Accordingly, this study may clarify the mechanisms underlying the inverse relationship between AD and cancer.
Single mutations in either the PSEN1 or PSEN2 gene have been reported to be associated with various cancer types. Mutations of PSEN1 have been associated with skin and gastric cancer, while PSEN2 mutations have been implicated in breast and lung cancers [11,13,22-24]. In addition, skin tumors were observed in mice with the loss of PSEN1 specific to the skin, and lung cancer was observed in PSEN2 knockout and PSEN2 knock-in mice [11,23]. Likewise, PSEN dKO was associated with carcinogenesis in the epidermis [12]. Given that PSEN single mutations and PSEN dKO have been extensively associated with various types of cancer, the relationship between AD and cancer needs to be examined in forebrain-specific PSEN dKO mice.
Interestingly, in our study using the forebrain-specific deletion of PSEN1 and PSEN2, none of the 7+18-M miRNAs were associated with skin cancer (Supplementary Table 1). However, within this category, 9 miRNAs (miR-128a, miR-136, miR-181a, miR-190, miR-204, miR-29b, miR-29c, miR-300, and miR-381) were associated with breast cancer, 2 miRNAs (miR-103 and miR-218) were associated with gastric cancer, and 5 miRNAs (miR-103, miR-140, miR-219, miR-29b, and miR-9) were associated with lung cancer (Supplementary Table 1). In contrast, a different pattern was observed in the 18-M miRNAs (Fig. 5B), among which 11 miRNAs (miR-106b, miR-130a, miR-20a, miR-222, miR-24, miR-27b, miR-29a, miR-30e, miR-365, miR-7a, and miR-7b) were associated with breast cancer, 9 miRNAs (miR-129-5p, miR-130a, miR-24, miR-27b, miR-29a, miR-30b, miR-335-5p, miR-338-3p, and miR-9*) were involved in gastric cancer, and 10 miRNAs (miR-132, miR-15a, miR-185, miR-195, miR-222, miR-27b, miR-30a, miR-487b, miR-7a, and miR-7b) were implicated in lung cancer (Supplementary Table 2). However, this group contained 3 miRNAs associated with skin cancer (let-7b, miR-365, and miR-374) (Supplementary Table 2). Moreover, studies investigating single mutations of PSEN and epidermis-specific PSEN dKO in mouse models have reported a link between PSEN genes and skin cancer. In contrast, our study of forebrain-specific PSEN dKO mice showed a relationship with skin cancer only in the 18-M miRNAs, which may imply that aging is a crucial factor in the inverse correlation for skin cancer.
In cancer research studies, miRNAs have been reported to promote or suppress tumor formation [25]. In particular, TSmiRNA are considered to be responsible for the downregulation of oncogenes, and are dysregulated in cancers of various tissue types [26]. In previous publications, 2 miRNAs identified in our study, miR-218 and let-7, were shown to have TS properties implicated in various types of cancers [27,28]. In most cancers, the downregulation of these miRNAs was a necessary step in the induction of carcinogenesis. Indeed, among the putative targets, several genes were established oncogenes, while some harbored likely oncogenic functions. Genes such as WNT2B, FZD4, and the protein kinase ROCK1 were predicted targets of miR-218 with possible oncogenic roles, and PDGFRA was another target of miR-218 that has been established as an oncogene primarily overexpressed in cancers of the central nervous system [29]. Among the putative targets of let-7, those with potential oncogenic functions included IGF1R, TCF7L1, E2F2, RALB, FGF4, and FGF23, whereas NRAS was an oncogene upregulated in melanomas [30]. Therefore, our results indicate that the upregulation of TS-miRNA in the forebrain of PSEN dKO mice may regulate the expression of oncogenes or genes with likely oncogenic function.
However, it should be noted that our study may be more specific to AD phenotypes than to cancer in general. Although the manipulation of PSEN genes is common in models of AD and cancer, other factors incorporated in the microarray analysis, such as tissue type (brain, hippocampus) and age (18 months), are particular to the pathology of AD. Therefore, it is plausible that changes in the expression of TS-miRNA were mainly observed in our results. To confirm the importance of TS-miRNA expression levels in the inverse correlation between AD and cancer, further studies should investigate whether the expression of onco-miRNA is increased under conditions more strongly associated with cancer (e.g., in the skin) resulting from PSEN gene manipulation.
Taken together, the age-dependent profiling of miRNA expression in the forebrain of PSEN dKO mice pointed to the upregulation of TS-miRNA in the hippocampus. These TS-miRNA, with targets in Cancer pathways, provide support for the inverse correlation of AD and cancer observed in clinical case studies. Since miRNAs are implicated in both diseases, further studies are required to investigate this select pool of miRNAs to determine their functional role in regulating the pathogenesis of both AD and Cancer.
SUPPLEMENTARY MATERIALS
Supplementary Tables 1 and 2 can be found via https://doi.org/10.5213/inj.1836274.137.
Notes
Grant/Fund Support
This research was funded by a grant from the National Research Council of Science & Technology (NST) by the Korean government (MSIP) (No. CRC-15-04-KIST). This work was supported by the Education and Research Encouragement Fund of Seoul National University Hospital (2018). This research was also supported by the National Research Foundation of Korea under the following grant: NRF-2017R1A2B2003993 (“Mid-career Researcher Program”).
Research Ethics
All animal experimental procedures were approved by the Institutional Animal Care and Use Committee (IACUC) of KIST, and were performed in accordance with the institutional guidelines and regulations on animal care and use from the IACUC for the management and use of laboratory animals.
Conflict of Interest
No potential conflict of interest relevant to this article was reported.
AUTHOR CONTRIBUTION STATEMENT
·Full access to all the data in the study and takes responsibility for the integrity of the data and the accuracy of the data analysis: SH, HII
·Study concept and design: SH, TKK, HII
·Acquisition of data: SH, HII
·Analysis and interpretation of data: SH, TKK, JR, HII
·Drafting of the manuscript: SH, TKK, JR
·Critical revision of the manuscript for important intellectual content: YSK, HII
·Statistical analysis: SH
·Obtained funding: YPT, HII
·Administrative, technical, or material support: YSK, YPT, HII
·Study supervision: YSK, YPT, HII