


INTRODUCTION
Overactive bladder (OAB) is defined as urinary urgency with or without incontinence, and is often associated with frequency and nocturia in the absence of bladder pathology [1]. Behavioral and pharmacological treatment (mainly antimuscarinics) are considered to be the first line of treatment. If behavioral and pharmacological treatment fails, the condition is considered refractory. Adding mirabegron may have opened new therapeutic windows, but this possibility has not yet been established in the long term. Nonetheless, there is a good level of evidence for the use of either antimuscarinics or mirabegron, with emerging data also supporting the use of combination treatment with both classes of drugs [2]. Failure of anticholinergics may be attributed to chronic exposure to antimuscarinics, resulting in reduced expression of M3 receptors, as opposed to purinergic receptors [3].
Botulinum neurotoxin type A (BTX-A) is now an established line of treatment for refractory OAB after the failure of medical treatment. Although its mechanism of action is known to involve the neuromuscular junction [4], the effects of BTX-A in the bladder appear more complex, and there is increasing support for a dual mode of action on both efferent and afferent pathways [5]. Intradetrusal injections of BTX-A are followed by significant improvements in incontinence episodes, urodynamic variables, and quality of life (QoL) [6]. However, its effect is temporary and fades within 6 months. In this situation, repeated injections could be offered. However, repeated intradetrusal injections of BTX-A are burdensome and costly, especially in lower-income countries, and BTX-A injections may also have troublesome side effects such as urine retention and infections.
Moreover, there is no firm recommendation according to the American Urological Association/Society of Urodynamics, Female Pelvic Medicine & Urogenital Reconstruction guidelines regarding which option should be offered in such cases. Posterior tibial nerve stimulation, sacral neuromodulation, open surgery, and combined treatment have shown conflicting results in terms of cost-effectiveness [7]. Furthermore, no studies have evaluated the synchronous use of anticholinergics with BTX-A or metachronous use after the effects of BTX-A fade in cases of refractory idiopathic OAB. Nevertheless, they may have synergetic or additive actions.
Accordingly, there is still a lack of knowledge regarding the effect of BTX-A injections on muscarinic receptor sensitization. Failure of antimuscarinics is related to the reduction of M3 receptor expression (as M3 is the more active component modulating detrusor function) in response to chronic use of antimuscarinics, rather than drug intolerability [3], and previous studies have documented that both anticholinergics and BTX-A may share the same afferent and efferent actions. In addition, previous clinical evidence has shown restoration of vesical urothelial and suburothelial receptors (in terms of number and efficacy) after BTX-A injections, with a possible mechanism being a decrease in the number of suburothelial afferent neurons expressing purinergic and vanilloid receptors [8,9]. Therefore, we postulated that restoration of these receptors may sensitize and augment the action of anticholinergics postinjection in cases that became refractory to the initial anticholinergic treatment.
MATERIALS AND METHODS
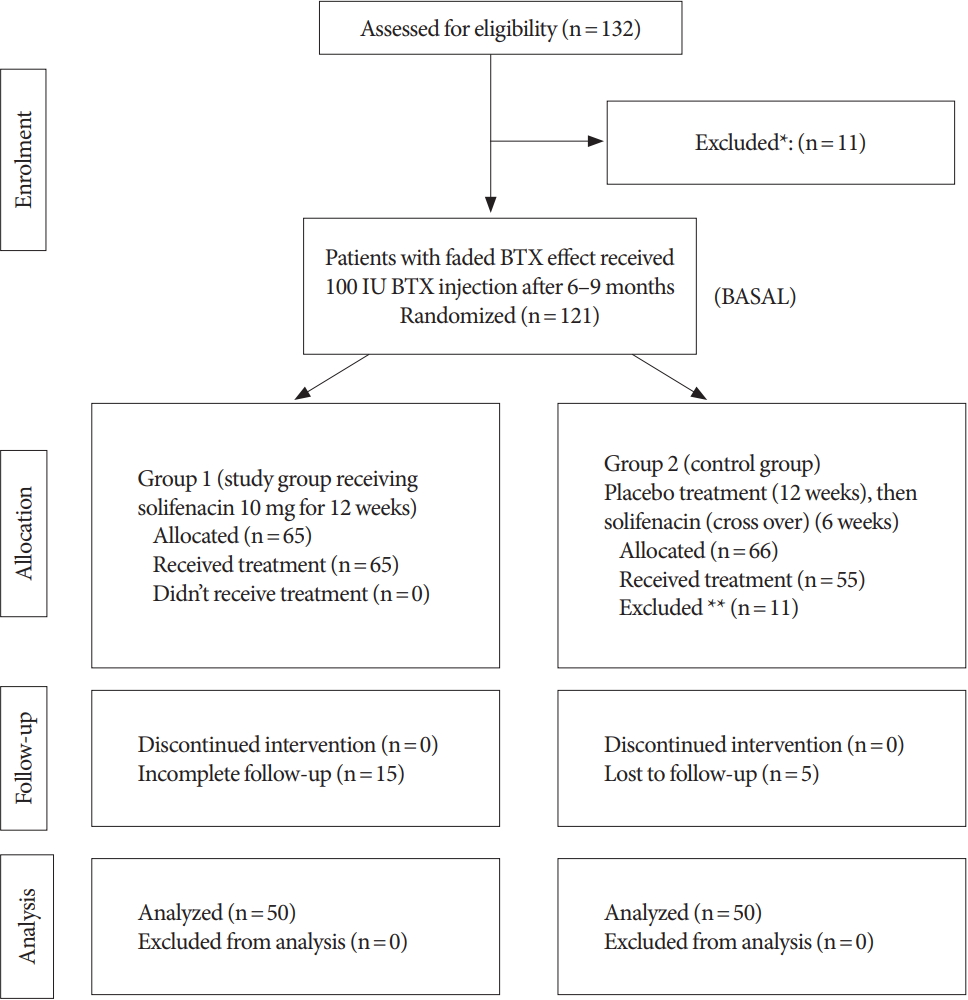
Among 132 patients with refractory idiopathic OAB diagnosed both clinically and with urodynamic studies who were followed up at our outpatient clinic between May 2016 and October 2018, 11 patients were excluded. In total, 121 patients were selected for inclusion in this blind, placebo, waiting-list, controlled study (Fig. 1). All the patients showed initial failure of 10 mg of solifenacin for 3 months (initial solifenacin), after which they were managed by intravesical injections of 100 IU of BTXA. After the effects of BTX-A faded (defined as the return of the overactive bladder symptoms score [OABSS] to near its baseline level before intravesical BTX-A injections), patients were randomly assigned to 2 groups: group A (including 65 patients initially), defined as the study group, in which patients were maintained on 10 mg of solifenacin for 12 weeks, and group B (including 66 patients initially), defined as the control group, in which patients were treated in 2 phases. In the first phase, all patients in group B received placebo treatment for 12 weeks (placebo phase), and in the second phase they received 10 mg of solifenacin for another 6 weeks (subsequent solifenacin). In all phases of the study, patients were blind to the type of treatment.
The exclusion criteria included the use of another anticholinergic drug other than solifenacin, age less than 18 years, neurogenic detrusor overactivity (DO), an active urinary tract infection (UTI) evidenced by positive urine culture, previous solifenacin intolerability, and the development of urine retention after BTX-A injections. After 12 weeks of follow-up, 15 patients in the study group had missed follow-up appointments or had incomplete data at the time of the evaluation. Additionally, 11 patients in the control group were excluded due to an active UTI during the follow-up period, and 5 other patients missed follow-up visits. Therefore, a final total of 100 patients completed the study (50 patients in each arm).
All patients underwent a physical examination, including stress tests and vaginal examinations in females and digital rectal examinations in males. A brief neurological examination was conducted. Baseline laboratory investigations (urinalysis and urine culture) and pelvic ultrasound with postvoid residual (PVR) urine volume measurements were conducted. In each study phase, information from the validated OABSS [10] and incontinence QoL (I-QoL) questionnaires [11] were collected by third-party staff not involved in the study. Baseline urodynamic testing consisted of noninvasive flowmetry, a cystomyogram and a pressure-flow study using a standardized research protocol that followed the International Continence Societyrecommended Good Urodynamic Practice Guidelines [12].
Eligible and consenting participants were randomized into the study group and control group on a 1:1 basis with a computer-generated program in blocks of random lengths.
The primary endpoint was assessment of the efficacy of anticholinergic treatment after the effects of BTX-A faded based on the total OABSS after 12 weeks of follow-up. Secondary endpoints included urodynamics parameters (maximum urinary flow rate, PVR, detrusor pressure at the maximum urinary flow rate, number and amplitude of DO, detrusor leak point pressure [DLPP], and maximum cystometric capacity) after 12 weeks of treatment in both study and control (placebo phase) groups. Tertiary objectives included assessment of risk factors of anticholinergic treatment failure in this particular group of patients who received BTX-A. Furthermore, complications were recorded after retreatment with solifenacin (10 mg) in both groups. Moreover, QoL changes after treatment in comparison with baseline were assessed using the I-QoL, which contains 3 elements: activation and ability, psychological impact, and socioeconomic impact. Treatment failure was defined as patient dissatisfaction (improvement of less than 50% in OABSS parameters), the need for intravesical BTX reinjection, or the addition of another anticholinergic drug after 3 months of follow-up.
Data were expressed as mean┬▒standard deviation or median (range) according to the distribution. Univariate and multivariate analyses (Cox regression test) to assess risk factors for response to antimuscarinics were done using the chi-square test, Fisher exact test, or independent t-test according to the circumstances. The independent t-test was used for assessing I-QoL responses. All statistical tests were carried out using IBM SPSS Statistics ver. 20.0 (IBM Co., Armonk, NY, USA). A P-value of less than 0.05 was considered to indicate statistical significance.
Since no prior study has addressed the use of anticholinergics after the effects of intravesical BTX-A injections fade, the sample size was calculated based on the noninferiority principle. The initial 10 patients at the start of the study were chosen for use in a pilot study, and the difference in treatment success according to improvement in the total OABSS between groups was 20%. This finding was supported by previous studies using solifenacin versus placebo treatment in OAB without intravesical BTX-A injections [13,14]. Based on this difference, 78 patients were required to be 90% sure that the upper limit of a 1-sided 95% confidence interval (CI) (or, equivalently, a 90% 2-sided CI) would exclude a difference in favor of the study group of more than 10%. Taking into account the high potential discontinuation rate, which we estimated as being as high as 20%, at least a total of 94 patients divided into 47 patients per group were required [15].
Fully informed consent was obtained from all patients after initial exclusion and just before randomization. The study was approved by the Institutional Review Board (IRB No. R/17.07.46) and the study protocol was also recorded at clinicaltrials.gov. There was no conflict of interest and no funding was received. Patients were managed according to the Declaration of Helsinki.
RESULTS
The study included 121 patients who were maintained on solifenacin (10 mg) initially before any intervention, of whom 100 patients (16 males and 84 females) completed the study. The mean age┬▒standard deviation was 32┬▒10 years. The median (range) of initial symptom duration before intravesical BTX-A injections was 8 months (1ŌĆō48 months) in the study group and 12 months (3ŌĆō34 months) in the control group. The patients started solifenacin (10 mg) treatment 1 month (1ŌĆō3 months) after fading of the effects of BTX-A. All OABSS questionnaire items before treatment were comparable in both groups at the time of initial treatment. Similarly, urodynamic parameters and PVR were analogous in both groups (Table 1).
After 12 weeks of follow-up, in comparison with the control group during the placebo phase, the study group showed significant improvements in daytime frequency, urgency, urge incontinence, nocturia, and total OABSS (P<0.0001). Patients in the study group showed a lower frequency of DO than those in the control group (1.2┬▒0.3 vs. 4.7┬▒1.2, P<0.0001). In addition, the amplitude of DO and DLPP were significantly lower in the study group (P=0.03 and P=0.01, respectively). Cystometric capacity increased significantly in the study group compared to the control group (P=0.007) (Table 2).
In the control group, comparing patientsŌĆÖ reported outcomes during the placebo phase and subsequent solifenacin phase, we observed significant improvements in all OABSS items (urgency, daytime frequency, nocturia, urge incontinence, and total score) in the later stage of treatment (P=0.0001, P=0.003, P=0.01, P=0.001, and P=0.001, respectively) (Table 2).
After 6 weeks of solifenacin use in both the control group in the subsequent solifenacin phase and the study group, OABSS and I-QoL improvements were comparable in both groups.
In the study group, the univariate analysis compared patients with failed treatment (n=14) (28%) and patients with a successful outcome (n=36) (72%) to assess factors affecting treatment response. Female sex, repeated intravesical BTX-A injections, and greater cystometric capacity were statistically significant predictors of success (P=0.001, P=0.0001, and P=0.002, respectively). In a multivariate analysis, repeated injections and increased cystometric capacity were independent factors predicting treatment success with relative risks (95% CI) of 5.1 (1.8ŌĆō5.8) (P=0.0002) and 1.4 (1.1ŌĆō7.8) (P=0.01), respectively (Table 3).
Almost no significant complications took place in either group. The most common complication was dry mouth, which occurred in 8 patients in both groups (study and control) (<1%). Two patients in the study group developed high PVR (more than 100 mL) and were advised regarding timed voiding. Their PVR decreased significantly by 2 months of follow-up without the need for clean intermittent catheterization.
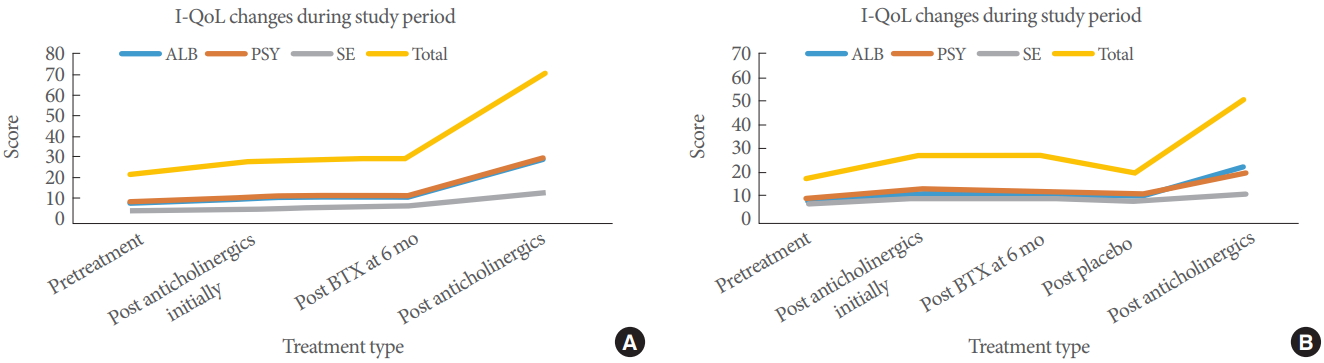
Regarding I-QoL, in the study group, all QoL elements and the total score improved significantly compared with placebo treatment in the control group. In different phases of treatment (initial solifenacin, 6 months after BTX-A injection [baseline], and subsequent solifenacin treatment) subsequent solifenacin treatment achieved a higher response than other phases. In the control group, all I-QoL elements and the total score improved significantly with subsequent solifenacin treatment, in contrast to the placebo treatment and initial solifenacin (Table 2) (Fig. 2).
DISCUSSION
Refractory OAB management still presents a dilemma. In most cases, OAB symptoms can be reduced, leading to improvements in patientsŌĆÖ QoL. It is well established that patients who do not respond to conservative behavioral treatment can use anticholinergics as a second line of treatment.
In OAB, it is known that hyperactive acetylcholine (Ach) secretion occurs by both neuronal and non-neuronal sources (urothelium). Furthermore, the increase in the sensitivity of the detrusor smooth muscle to Ach provokes local contractions of the detrusor (micromotion). These local contractions in the bladder wall produce afferent signals, precipitating urgency and DO [16].
Antimuscarinics suppress local contractions in the detrusor, eventually reducing bladder afferent activity by inhibiting the action of Ach on muscarinic receptors. M2 receptors are the most common receptors within the bladder wall, but M3 is a more active component modulating detrusor function [17]. In using antimuscarinics, DO is decreased by a dual mechanism of action in both efferent and afferent neuronal pathways [18]. Antimuscarinics may fail due to causes related to patient intolerability, inadequate dose titration, or side effects [19]. Furthermore, the reduction of M3 receptor expression in response to the chronic use of antimuscarinics provides another explanation for such failure.
In cases resistant to anticholinergic treatment, intradetrusal BTX-A injections could be offered [20]. Chapple et al. [21] documented that BTX-A (100 U) treatment was associated with clinically relevant reductions in all OAB symptoms compared with placebo treatment. These benefits were maintained briefly for a mean of 6ŌĆō9 months after treatment [22]. After the fading of the effects of BTX-A effects, patients may prefer to change to another line of treatment, as documented by the finding of Hashim et al. that only 9% of patients preferred BTXA reinjection, which may have been due to higher costs and side effects such as urinary retention and UTIs [23]. Based on previous studies, both anticholinergics and BTX-A may share the same afferent action, as suggested by clinical findings and immunohistochemical assays assessing the affinity and number of intravesical receptors, which showed evidence that BTX-A injections could restore the number and efficacy of intravesical urothelial and suburothelial receptors [8]. In neurogenic DO [24], it has been documented that concomitant use of both treatments improved OAB symptoms, increased time to reinjection, and decreased both the dose and frequency of anticholinergic use.
In the ABC trial, which tested the effects of solifenacin (5 or 10 mg) in comparison with BTX-A for 6 months, both groups showed similar reductions in daily episodes of urge incontinence [18]. Furthermore, many authors [13,25] found statistically significant improvements at 12 weeks of follow-up regarding urgency, incontinence, and frequency in patients who used solifenacin once daily compared with a placebo group. Additionally, notable improvements in QoL domains were correlated with improvements in nocturia symptoms. Interestingly in our study, patients who were refractory to solifenacin at the initial treatment before shifting to BTX-A developed responsiveness again, with an improvement of all OABSS items and overall score at 12 weeks of follow-up in the study group. Moreover, in the control group, all OABSS items and the total score improved after the subsequent phase of solifenacin treatment for 6 weeks relative to the phase of placebo treatment. Furthermore, improved urodynamic parameters (decreased frequency and amplitude of DO, DLPP, and increased cystometric capacity) in the study group were noted. In the assessment of factors affecting treatment response, repeated intravesical BTX-A injections and increased cystometric capacity were independent factors that predicted a successful response. A possible explanation for this is that intravesical BTX-A injections and anticholinergics increase bladder capacity, volume at first reflex detrusor contraction, and bladder compliance and decrease detrusor pressure during bladder filling and voiding [26]. These factors could explain why solifenacin may again yield a response after initial failure, as repeated BTX-A injections may result in increased bladder capacity and restoration of the normal numbers and function of M3 receptors, potentially restoring patientsŌĆÖ responsiveness to anticholinergic drugs. We did not include patients in the control group after subsequent solifenacin treatment in final statistical analysis, as they were maintained on active treatment for only 6 weeks.
As a chronic, unbearable condition, OAB harms QoL, including social, physical, psychological, occupational, and sexual domains. Many patients stopped their social and physical activities and suffered from psychological stress. It was reported that once daily solifenacin treatment was associated with significant improvements in QoL compared with placebo [27]. In a large clinical study (VOLT) [28], it was reported that solifenacin improved all subscales of QoL. Furthermore, Anger [29] documented in a metanalysis of 4 previous studies that BTX-A treatment improved QoL scores, as shown by a 15-point drop in Urinary Distress Inventory scores compared to placebo-injected patients. In our study, improved OABSS co-occurred with significant improvements in I-QoL items and the total score in response to the usage of solifenacin after fading of the effects of BTX-A in the study group in comparison with initial solifenacin treatment and baseline findings. Additionally, the I-QoL items improved in the control group after the crossover treatment period in the subsequent solifenacin phase for 6 weeks after the placebo treatment phase.
Insignificant complications occurred in both groups. Dry mouth was the most relevant complication. Two patients in the study group developed urinary retention, as shown by an elevated PVR, and were treated conservatively.
The limitations of this study include the possibility of bias by including patients who were maintained previously on solifenacin before intravesical BTX-A injections. However, this might provide insights into changes in the effects of a single fixed treatment course. Using the noninferiority principle in sample size calculation had some disadvantages; it would be necessary to have a larger number of patients with strict compliance to treatment with longer-term follow-up to prove the efficacy of treatment, and the noninferiority principle needs only 1 measurable outcome to calculate the sample size. However, the most important advantage of a noninferiority trial is that it provides clear evidence of the efficacy of treatment. Despite the relatively small sample size, we were able to detect factors affecting treatment response, as most clearly shown by the sex difference between treatment responders and non-responders, especially in the univariate analysis. A larger study population is needed to confirm our results. It would also be helpful to biopsy bladder tissue and quantify receptor expression before and after treatment to better delineate the mechanism action and to establish the interactions between these treatments.
In patients with refractory idiopathic OAB, reuse of anticholinergics could be an effective treatment option in patients after fading of the effects of BTX-A. The use of this line of treatment can delay or eliminate the need for reinjections of BTX-A. Repeated intravesical BTX-A injections and increased cystometric capacity could affect the treatment response.