Relationship between Body Mass Index and Overactive Bladder in Women and Correlations with Urodynamic Evaluation
Article information
Abstract
Purpose
Overactive bladder (OAB) is a common condition. In women, studies have shown that the prevalence of OAB is positively related to increasing body mass index (BMI). Our objective was to define a relationship between BMI and OAB through correlation with urodynamic study (UDS).
Methods
A prospective study was conducted. Ambulatory women aged 18 years or older who had symptoms of OAB for at least 3 months were enrolled. Patients answered a questionnaire, had their weight and height recorded, and underwent UDS. Patients were categorized into 3 groups as follows: group 1, BMI<25; group 2, BMI 25 to 29.9; and group 3, BMI≥30.
Results
A total of 113 patients were examined (group 1, n=32; group 2, n=40; group 3, n=41). The patients' mean ages were 50, 55, and 59 years for groups 1, 2, and 3, respectively (P<0.05). Group 3 showed a significant increase in the incidence of subjective mixed leakage and the number of pads used compared with groups 1 and 2. No significant differences were seen among the groups in duration of symptoms, OAB V-8 score, or the incidence of subjective urgency or stress leakage. The UDS parameters of groups 1, 2, and 3 showed no statistically significant differences for most variables. Group 3 showed a significant increase in the incidence of urge leakage by UDS compared with group 2 only.
Conclusions
Increasing BMI was age related. A BMI≥30 showed a higher incidence of subjective urinary mixed leakage and pad use. UDS showed no significant correlation between OAB and any BMI category for most UDS parameters.
INTRODUCTION
Overactive bladder (OAB) is a common disabling condition that affects health-related quality of life [1]. It has been described as a "syndrome of symptoms" and is defined by the International Continence Society (ICS) as urgency, with or without urge incontinence, usually with frequency and nocturia, in the absence of causative infection or pathological conditions [2,3]. The group of symptoms that constitute OAB can be interchangeably referred to as lower urinary tract symptoms of an irritative nature. Although several patients with idiopathic OAB do not show abnormal contractions during urodynamic study (UDS), in the absence of neurological disease, urodynamic findings in OAB patients can be characterized by the presence of involuntary bladder contractions that occur during bladder filling despite the patient's attempt to suppress them [4]. The condition is not uncommon, with earlier reports estimating that about one in six adults in the United States and Europe have OAB [4,5].
It has been shown that obesity in adulthood is linked to an increased risk of disability throughout life and a decrease in the length of time spent free of disability [6]. In women, the prevalence of OAB symptoms has been shown to be positively related to increasing body mass index (BMI) as shown by several authors [7-12]. Nevertheless, all of these studies were epidemiologic in nature and thus provided subjective evidence for such a relationship at best. To our knowledge, published data correlating BMI and OAB in women by use of an objective tool are lacking. In a short review from 2000, Cummings and Rodning concluded that additional neurophysiologic and UDS results are needed to better define the association between obesity and incontinence [13]. The objectives of this study, therefore, were first to look for any association between OAB symptoms and BMI in a group of women with OAB symptoms and second to look for any correlation of BMI with UDS findings in these women.
MATERIALS AND METHODS
Subjects
This was a prospective analysis of patients presenting to the clinician's office for consultation regarding OAB symptoms. The analysis was based on data that were regularly collected when these patients with OAB presented to our practice and that represent our standard of care. Data collection was kept anonymous.
The inclusion criteria were an ambulatory woman (≥18 years of age) with symptoms of OAB lasting at least 3 months who was able to complete an OAB questionnaire (OAB-q) correctly and who had an OAB V-8 score ≥8. Patients were included if they were taking anticholinergics or antispasmodic medication; however, they needed to undergo a minimum 14-day washout period before the UDS.
Exclusion criteria were previous bladder or pelvic surgery, previous incontinence surgery, previous pelvic radiation, clinically significant outflow obstruction, active urinary tract infection, chronic inflammation such as interstitial cystitis and bladder stones, neurological disease (Parkinson's disease, stroke, multiple sclerosis, spinal cord injury), poorly controlled diabetes mellitus, history of bladder or pelvic cancer, previous diagnosis of neurogenic bladder, pregnancy, congestive heart failure, postvoid residual (PVR)>200, and excessive fluid intake of >3 L per day.
Assessment
The OAB screen was based on the 8-item OAB Symptom Bother Scale of the OAB-q (V-8), which is a validated questionnaire. Responses were made on a 6-point scale ranging from 0 (not at all) to 5 (a very great deal) for the degree of bother. Patients were considered to have OAB if their OAB V-8 score was ≥8 [14]. During the initial office visit, as per our usual initial consultation, patients provided a medical history, underwent a physical examination, and completed the OAB V-8 questionnaire. On the basis of the initial consultation, some patients underwent UDS (video and nonvideo) and/or cystoscopy. Patients with OAB who completed the V-8 questionnaire and underwent UDS were used for the analysis on the basis of the inclusion and exclusion criteria. UDS was performed according to the ICS guidelines [15]. Patients who did not meet the inclusion criteria were excluded. A total of 113 patients underwent UDS. After placement of a 14 Fr two-way Foley catheter (Rusch, Gold), 4 Fr/60 cm bladder pressure catheter (Cook Medical Inc., Bloomington, IN, USA), and 8 Fr/107 cm rectal pressure tube (Tyco Healthcare Kendall, Argyle, NY, USA), the bladder was filled with normal saline or contrast solution at a rate of 25 to 50 mL/min. The parameters assessed by UDS included storage phase (bladder volume at first desire to void, bladder volume at strong desire to void, maximum cystometric capacity, bladder compliance, detrusor overactivity, detrusor leak point pressure [DLPP], cough stress test, Valsalva leak point pressure [VLPP]) and voiding phases (maximum detrusor pressure, detrusor pressure at maximum flow rate, maximum flow rate, voided volume, PVR, excluding pelvic electromyographic activity). Urethral pressure measurements were not conducted. A Laborie TRITON (Laborie Medical Technologies Co., Mississauga, ON, Canada) multichannel urodynamic system was used for all measurements.
BMI is a practical and easy index that requires accurate measures of a person's weight and height. It is calculated as weight in kilograms divided by the square of height in meters (kg/m2). All subjects had their weights and heights measured and BMI was calculated at the time of UDS. For the purpose of our analysis, patients were categorized into 3 BMI groups of <25 (normal weight), 25 to 29.9 (overweight), and ≥30 (obese). Two patients had a BMI of <18.5 corresponding to underweight. These two subjects were included in group 1 (normal weight) because their subjective and objective findings were not significantly different from those of the patients in group 1.
Statistical Analysis
Chi-square tests were used to evaluate nonparametric data; z-tests and analyses of variance were used to evaluate parametric data. All tests were two-tailed with an alpha of 0.05. Values are presented as means with ranges.
RESULTS
Data from a total of 113 patients were examined (group 1, n=32; group 2, n=40; group 3, n=41). The patients' mean age was 50 years (range, 24 to 80 years), 55 years (range, 36 to 77 years), and 59 years (range, 38 to 80 years) for groups 1, 2, and 3, respectively (P<0.05), which was a statistically significant difference (Table 1). The majority of the patients' population were anticholenergics naive prior to our study. Only 5 patients were on tolterodine for a short period on presentation that was stopped two weeks prior to the UDS testing (1 patient from group 1, 3 patients from group 2, and 1 patient from group 3).

Comparison of quantitative data between the three groups (n=113)
Subjectively, group 3 showed a statistically significant increase in the incidence of mixed leakage (P<0.05) and the number of pads used (P<0.05) when compared with groups 1 and 2 according to the patients' medical history (Tables 2-4). There were no significant differences among the groups in duration of symptoms, OAB V-8 score, or the incidence of urgency or stress leakage on the basis of the patients' medical history (Tables 1-4).
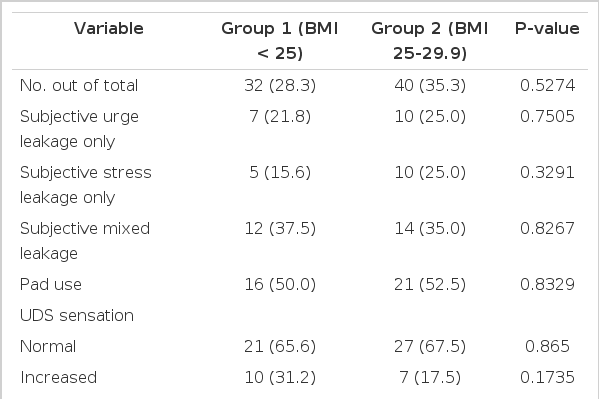
Comparison of qualitative data between groups 1 and 2 (n=113)
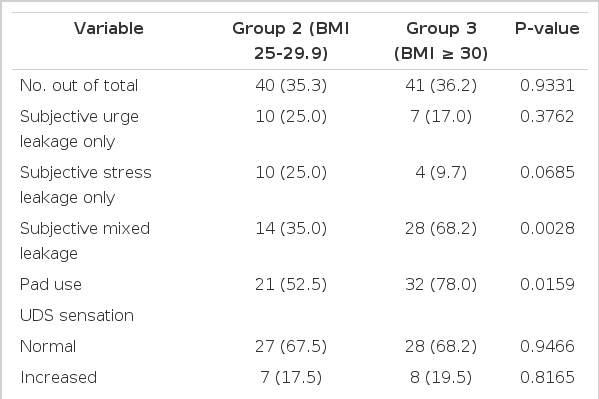
Comparison of qualitative data between groups 2 and 3 (n=113)
Objectively, the UDS parameters of groups 1, 2, and 3 showed no statistically significant differences for most variables, including sensation, compliance, involuntary contractions, pressure amplitude, DLPP, stress leakage, and VLPP (Tables 1-4). However, group 3 showed a significant increase in the incidence of UDS urge leakage (P<0.05) when compared with group 2 but not group 1 (Tables 3, 4).
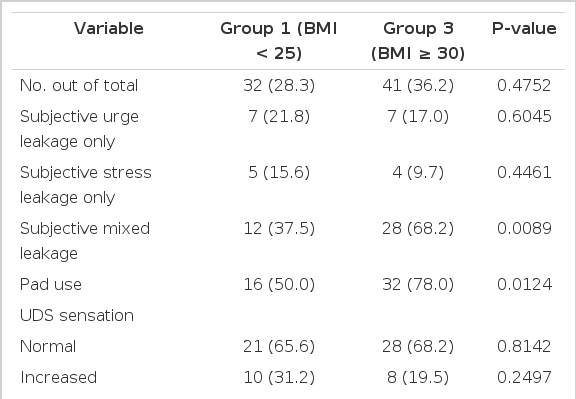
Comparison of qualitative data between groups 1 and 3 (n=113)
DISCUSSION
BMI in the range of 25 to 29.9 and ≥30, which corresponds to overweight and obesity, respectively, has been shown to be an independent risk factor for OAB in women [6,16]. The exact mechanisms explaining the link between obesity and OAB are not well known, however. One hypothesis suggests that excess body weight increases intra-abdominal pressure, which in turn increases bladder pressure and intravesical pressure, thus leading to overactivity [17,18]. In theory, increased abdominal pressure "stresses" the muscle, connective tissue, and innervations of the pelvic floor, which may lead to overt structural damage or neurologic dysfunction [19]. One other possible mechanism has been linked to ghrelin-a peptide hormone associated with obesity and metabolism [20]. Tyagi et al. [20] were able to demonstrate the expression of mRNA for the ghrelin receptor-growth hormone secretagogue receptor (GSHR)-in human bladder. It is hypothesized that the low plasma ghrelin levels observed in obese OAB patients may upregulate the expression of GSHR in the bladder, which may diminish detrusor storage function and lead to OAB [17].
Our study showed that higher BMI was related to increasing age. This agrees with other published results [21,22]. This has been explained secondary to the changes in appetite, food intake, energy expenditure, and body composition that normally occur with aging, with an increase in fat mass and a decrease in muscle mass [23,24].
Of the 113 patients we assessed with OAB, 81 (72%) fell in the category of high BMI (≥25). Although it is premature to conclude that this represents a true population prevalence of OAB in relation to the different BMI categories on the basis of the limited number of women examined, this does represent the pattern of patients' referral that most urologists see in their practices. Our study indicated that a BMI≥30 was associated with a higher incidence of patient-reported urinary mixed leakage and pad use. This finding also agrees with other published data. Hannestad et al. [12] showed a positive correlation between BMI and incontinence, and this association has been demonstrated for all subtypes of incontinence (urge, stress, and mixed), particularly severe combined urge urinary and stress incontinence. In the Heart and Estrogen/Progestin Replacement study, Grady et al. [25] demonstrated that increasing BMI was a significant predictor of combined urge and stress incontinence. Because higher BMI was age related, one may conclude that the above observation could be related to lower activity levels in older women. Another possibility is that the increased rate of urge incontinence in older women makes stress incontinence symptoms harder to isolate, which thus makes it harder to distinguish pure urge leakage from pure stress leakage or mixed leakage.
Objectively, our UDS assessment did not show a significant correlation between OAB and any BMI category for most UDS parameters except for urge leakage in the comparison of groups 2 and 3. Although statistically significant, this finding between groups 2 and 3 may be purely a coincidence, because the number of subjects in each group was relatively small. This is in contrast with the subjective data based on medical history. Although the baseline OAB disease severity was statistically more severe in the more obese study population for some of the examined parameters, the clinical significance of this observation is unknown because it was not supported by UDS correlation.
The limitations of our study include the small number of subjects in each subset and the fact that the patient population was referral based and thus may not be a true representation of the population. In other words, the patients examined in our series were already referred for OAB and thus represented a biased population. Proceeding to UDS was done on the basis of the severity of the patients' symptoms and also on the basis of whether they wanted to proceed to undergo the studies. The ideal study would be to take all comers (women) regardless of symptoms and have them all complete the questionnaire and then all go on to undergo UDS. Unfortunately, this is difficult to do and not clinically relevant because we deal with patients and symptoms. Nevertheless, this study is one of the first studies to examine the association between increased BMI and OAB symptoms with the use of an objective tool as opposed to only establishing an epidemiologic association. Such a study should act as a base for future studies of a similar nature that are higher powered to provide a more definite answer to the role of weight loss in controlling urinary symptoms in the era of increasing obesity worldwide.
In conclusion, increasing BMI was age related. BMI≥30 appears to be associated with a higher incidence of patient-reported urinary mixed leakage and pad use. UDS assessment did not show a significant correlation with any BMI category for most UDS parameters except for urgency leakage. A larger random population series is warranted to define the relationship between BMI and OAB and UDS findings.
Notes
Sidney B. Radomski is advisory board member of Astellas, Pfizer, Allergan and researcher for Astellas and Allergan.