Effect of Resistance Exercise on Acquired Immunocytes in Cancer Survivors: A Pilot Study
Article information

Abstract
Purpose
The purpose of this study was to elucidate the effect of resistance exercise on skeletal muscle mass-related fitness and acquired immune cell function in ovarian cancer survivors.
Methods
Twelve ovarian cancer survivors aged 33–61 years participated voluntarily in this study and were divided into control group (CG, n=6) and exercise group (EG, n=6). They underwent removal of ovarian cancer and received regular care for over one year. Resistance exercise was used as the intervention program conducted 4 days a week for 12 weeks. Skeletal muscle mass, muscle strength, and endurance were assessed at baseline and at week 12. Other dependent variables included adaptive immunocytes related to helper T (Th) cells and immunosuppressors (CD4+ and CD8+).
Results
After the intervention, skeletal muscle mass showed positive changes in EG com-pared to CG, although not significantly different. Muscle strength and endurance significantly increased in EG, while there was no significant change in CG. Th1, Th2, and Th1/Th2 ratio were significantly different between both groups. CD4+CD25+T cells and CD4+PD-1+T cells of EG were lower than those of CG. CD8+PD-1+T cells and CD8+TIGIT+T of EG were lower than those of CG. These results can be interpreted as the improved sensitivity of CD4+ and CD8+, which helps the secretion of myokines and cytokines, when cytotoxic substances are injected into the human body.
Conclusions
This study suggests that resistance training improves upon desirable changes in adaptive immune cell responses in ovarian cancer survivors by maintaining skeletal muscle mass while developing strength and endurance.
• HIGHLIGHTS
- When a cytotoxic substance is injected into the body, it increased the sensitivity of CD4+ and CD8+.
- Resistance exercise for ovarian cancer survivors showed a trend toward increased skeletal muscle mass.
- Resistance training improved upon desirable changes in adaptive immune cell responses in ovarian cancer survivors.
INTRODUCTION
Cancer is a major cause of premature death, comprising a group of diseases in which uncontrolled cell growth leads to the compression, invasion, and degradation of surrounding healthy tissue [1]. Blood or lymphatic fluid transports malignant cells to peripheral organs to form secondary colonies [2]. Symptoms of cancer vary depending on the type and location. However, many types of cancer cause weight loss (cachexia), fatigue, and decreased physical ability due to poor fitness and muscle atrophy [3,4]. In order to treat or prevent cancer from occurring or reoccurring, it is necessary to strengthen the body’s immune system. Actively performing physical activity or exercise is known as one of the easiest ways to boost immuno-cyte function [5,6].
Cancer patients may become physically inactive because of general malaise, poor appetite, demanding treatment categories (i.e., surgery, chemotherapy and radiotherapy), and other factors or their combinations [1]. Chemotherapy further enhances the risk of infection and results in physical inactivity, sarcopenia, and waning physical fitness. Even after many treatments, cancer cells may reappear or metastasize to other organs. Physical inactivity accounted for 2.9% of all cancer patients. The combination of excess body weight, alcohol intake, poor diet, and physical inactivity accounted for 13.9% of cancer cases in men, but accounted for the higher proportion (22.4%) of cancer cases in women [3]. Moreover, approximately 20% of cancer patients died by cachexia [4]. In cachectic patients, a loss of 25% of body weight represents an approximately 75% reduction in skeletal muscle protein [7]. Since these conditions affect the quality of life, more attention has been paid to the importance of physical activity and/or exercise in recent years in enabling cancer patients to function normally [8]. Substantial epidemiological evidence shows that a physically active lifestyle protects against the development of several cancer types [9,10]. Additionally, various observational studies have shown that even after a cancer diagnosis, people who are physically active have a much higher chance of surviving than those who are not physically active. These studies show that physically active patients are nearly twice as likely to survive [11].
Physical activity promotes the synthesis and secretion of peptides from anti-inflammatory cytokines and myokines [12]. In particular, regular exercise is known to facilitate the immune system by activating cytokines or myokines more actively than general physical activity. In this regard, some previous studies have reported that moderate exercise enhances the immune system, whereas high intensity exercise weakens it [13]. That is, vigorous exercise increases in the levels of pro-inflammatory and anti-inflammatory cytokines along with naturally occurring cytokine inhibitors and chemokines [14]. Generally, most researchers have reported that low to moderate-intensity exercise positively influences innate immunocytes which are composed of macrophages, neutrophils, dendritic cells, natural killer cells, and acquired immunocytes consisting of B- and T- cells (CD4+ and CD8+) [13].
Resistance training has significant benefits for patients in the short and long term as it has the potential to prevent many of the side effects of cancer treatment [15]. When loading skeletal muscles, it is recommended to use a load equivalent to 1-12 repetition maximum (RM) in a periodic manner. Focus on the 6-12 RM zone with 1-2 minutes rest between sets at medium speed. That is, higher volume, multiset programs are recommended to maximize hypertrophy [16]. The benefits of resistance training include improved strength and physical condition and reduced fatigue, all potentially leading to improved quality of life [8,11]. Therefore, resistance exercise may have beneficial effects in cancer patients and/or survivors in terms of reducing muscle atrophy or recovering from muscle atrophy, as well as improving myofunction and a diversity of biomarkers [1,17].
Since acquired immunity is regulated by the secretion of cytokines and myokines that can suppress cancer cells in cancer survivors [18], it is necessary to identify and analyze them. Therefore, this study was started to find out what changes in acquired immune cells occur when the intensity of resistance exercise, which is known to cause the most muscle hypertrophy, is applied to female cancer survivors.
MATERIALS AND METHODS
Participants
Ovarian cancer survivors aged 33–61 years voluntarily participated in this study. The inclusion criteria were as follows: being enrolled in the Department of Exercise Immunity for Cancers at Songdo Hospital in Seoul, having underwent removal of ovarian cancer, and having received regular care for over one year. Initially, 8 participants were screened for eligibility based on the aforementioned criteria, but 2 participants declined to participate in the study. Hence, the remaining 6 participants were finally enrolled. The participants were classified into an exercise group (EG, n=6) and a control group (CG, n=6). The physical characteristics of the participants are presented in Table 1.

Physical characteristics of the participants
Experimental Design
The ovarian cancer survivors and their family members were continuously motivated to complete the tests and to regularly participate in the exercise regimen. They completed self-reported questionnaires about their health status and learned how to record their daily diet and general physical activity in a diary. The assessments were performed at week 0 (baseline) and at week 12. Resistance exercises were used as the intervention program, which was conducted for 12 weeks, 4 days a week. The physical fitness components that were examined included body composition, muscle strength, and muscle endurance. Other dependent variables included adaptive immunocytes related to helper T (Th) cells and immunosuppressors (CD4+ and CD8+). The study was approved by the institutional review board of Songdo Hospital in Seoul (2021-008).
Blood Sampling and Analyses of Immunocytes
Flow cytometry, antibody staining and so on of this study were done using products of BD Bioscience (Franklin Lakes, NJ, USA). A lysed whole blood technique with maximum 8-color staining of blood cells was used. For each cell type, the respective antibodies were used. All antibodies were titrated to determine optimal concentration. For isotype control, isotype antibodies corresponding to each antibody were used. Antibody mixtures were different in accordance with each panel. Blood samples were distributed into 12×75-nm polypropylene round-bottom test tubes and stained with antibody mixtures for 30 minutes at room temperature in the dark. Then, red blood cells were lysed by adding 1 mL of FACS Lysing solution into each tube for 20 minutes. Cells were washed 2 times with 1×phosphate buffered saline (PBS) by centrifugation at 1,500 rpm for 5 minutes and then resuspended in 200 μL of PBS. After 2 washes, the remaining cells were permeabilized by adding 500 μL of Perm/Wash Buffer for 5 minutes and then centrifuged at 1,500 rpm for 5 minutes. Cells were stained with intracellular antibody mixture and washed with PBS. After washing, the cells were resuspended in 200 μL of PBS and analyzed by BD CantoII flow cytometer running FACSDiva software version 8.0.2 (BD Bioscience). Isotype antibodies are in the same class of immunoglobulins as a specific antibody for using isotype control that are assumed not to be present on or in the cells under study [19,20]. Isotype antibodies of this study were used for fluorescence minus one control and confirmed negative population of antibodies.
Measurement of Body Composition and Fitness Factors
A bioelectrical impedance analysis method was used to measure the participants’ body composition (Accuniq BC 720, Accuniq, Deajeon, Korea). Participants stood upright with their feet on the paw electrodes without holding on to the handles. The variables of body composition in this study were height, weight, skeletal muscle mass, body fat mass, and body mass index. Muscle strength was measured using a grip strength test using a Smedley dynamometer (TKK-5401, Takei Inc., Tokyo, Japan). The muscles involved included the hand muscles and the flexors of the brachial muscles.
Measurement of Calorie Intake and Calorie Output
During the study, the participants in the EG and CG agreed not to change their dietary methods and daily activity patterns. To confirm the equivalence of regular diet and daily physical activity, we provided 2 control variables to the participants. First, a diary was provided to record what was eaten in the morning, lunch and dinner during the experiment period. An expert entered the type and amount of food into CAN-Pro 5.0 (http://canpro5.kns.or.kr; Korean Nutrition Society, Seoul, Korea) every day, calculated the calorie intake, and evaluated it at the end of each month. The recorded calorie intake data were averaged at 4, 8, and 12 weeks and analyzed. Second, the amount of daily physical activity other than the experiment was recorded and calculated using the abbreviated form of the International Physical Activity Questionnaire [21]. Participants responded to questionnaires based on their physical activity records over the past 7 days during the 12-week study period. Daily calorie output was calculated as metabolic equivalents/min (kcal/kg/min) at the end of each month (Table 2). Using Table 2, the total score was obtained by summing the duration and frequency of walking, moderate-intensity activity, and vigorous activity.

Category scores by the international physical activity questionnaire
Resistance Exercise Program
This study was applied to ovarian cancer suvivors with an acceptable range 12 repetition maximum (RM) to 6 RM that could cause muscle hypertrophy based on previous studies [16,22]. The EG participated in a progressive exercise program 4 times per week. The participants began with warm-up conditioning for 10 minutes, as instructed by a trainer. Then, all participants performed the workout session for approximately 50 to 60 minutes. Prior to workout, the measurement of RM for each week was carried out. Resistance exercise for workout was performed at 12 RM for week 1 to week 3, 10 RM for week 4 to week 6, 8 RM for week 7 to week 9, and 6 RM for week 10 to week 12. Specifically, the chest press, lateral pulldown, chest butterfly, rowing for upper back, and semisquat were performed every Monday and Wednesday. Rest was given on Thursday, and the abdominal crunch, leg extension, leg curl, calf raise, and leg raise were performed on Tuesday and Friday. All resistance exercises were performed in 3 sets. After these exercises, 10 minutes of stretching was performed in a sitting position and lying position.
Statistical Analyses
The sample size was determined using G*Power v. 3.1.9.7, considering a priori effect size of f2 (V)=1.00, α error probability=0.05, power (1-β error probability)=0.95, number of groups= 2, and number of measurements=2. IBM SPSS Statistics ver. 22.0 (IBM Co., Armonk, NY, USA) was used to perform all statistical analyses, and the Shapiro–Wilk test was used to check the data distribution. All data were expressed as the mean and standard deviation. Based on the findings of the normality test, the nonparametric Mann–Whitney U-test was used to examine the differences in variables between the EG and CG. Additionally, the nonparametric Wilcoxon signed-rank test was used to examine differences in variables between the baseline and week 12 time points. The statistical significance was set at P<0.05.
RESULTS
Comparison of Demographic Factors
As depicted in Table 1, there were no significant differences between groups prior to the experiment. Table 3 outlines the mean calories from daily physical activity and daily diet between CG and EG during the experimental period. There were no significant differences in the 2 controlled variables.

Differences of controlled variables between groups
Skeletal Muscle Mass and Myofunction
The skeletal muscle mass, grip strength, and muscle endurance (sit-ups) show no significant differences between EG and CG at baseline, as displayed in Table 4. However, although the muscle mass of EG were higher than that of CG, there were no significant (Z=-1.764) differences. Strength (Z=-2.898) and muscle endurance (Z =-2.945) of EG were significantly higher than that of CG.
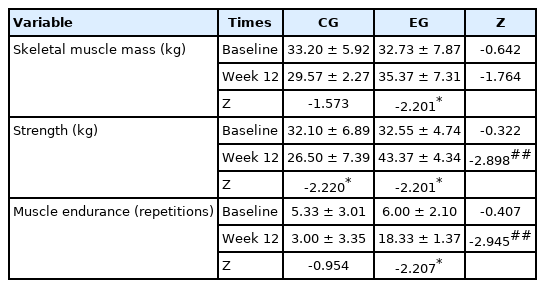
Comparative results of skeletal muscle mass and myofunction
Adaptive Immunocytes Function
As displayed in Table 5, Th1, Th2, and Th/Th2 ratio were not significantly different between both groups at baseline. After 12 weeks, there were significant differences between both groups. The significance of these results shows that resistance exercise within the range used in this study causes hypertrophy, which can induce significant changes in helper T cells. Although all variables were not significantly different between both groups at baseline as shown in Table 6, CD4+CD25+T cells (percentage and absolute value) and CD4+PD-1+T cells (percentage and absolute value) of EG were higher than those of CG at week 12 as shown in Fig. 1. These results can be interpreted as an increase in the sensitivity of CD4 cells, which helps to secrete myokines and cytokines when cytotoxic substances are introduced into the human body due to the hypertrophy caused by resistance exercise. Although all variables were not significantly different between both groups at baseline as shown in Table 7, CD8+PD-1+T cells (percentage and absolute value) and CD8+ TIGIT+T (percentage value) of EG were higher than those of CG at week 12 as shown in Fig. 2. This result means that the hypertrophy caused by resistance exercise increases the cytotoxicity to human antigens and pathogens, including cancer cells.

Comparative results of adaptive immunocytes related to helper T (Th) cell

Comparative results of adaptive immunocytes related to immunosuppression (CD4+)

Differences of helper T cell (CD4+) between control and exercise groups. #P≤0.05 and ##P≤0.01 when compared with exercise and control groups.
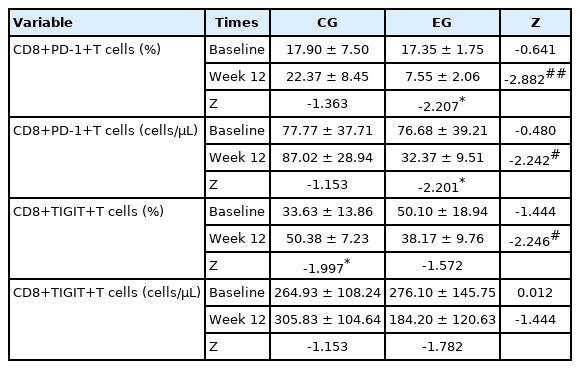
Comparative results of adaptive immunocytes related to immunosuppression (CD8+)
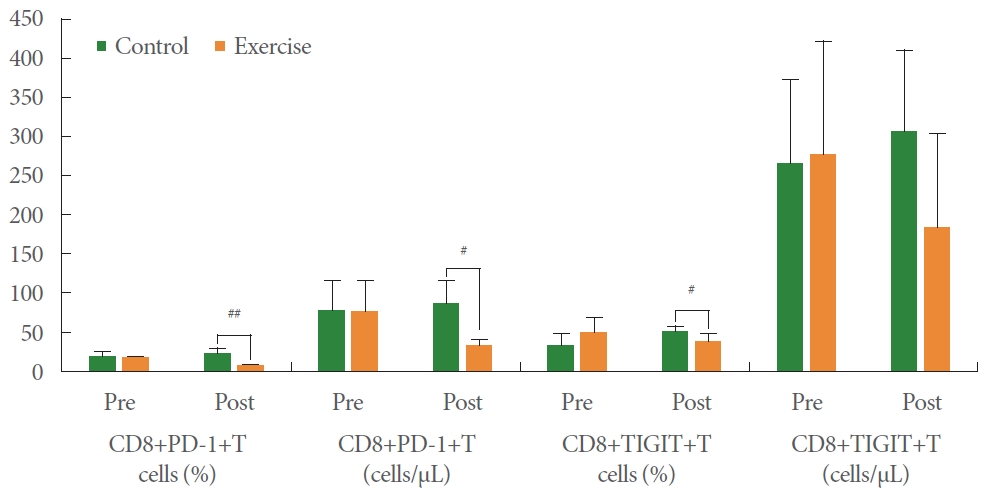
Differences of cytotoxic T cell (CD8+) between control and exercise groups. #P≤0.05 and ##P≤0.01 when compared with exercise and control groups.
DISCUSSION
This study showed that resistance exercise improved muscle strength and muscle endurance in the EG, thus resulting in desirable changes in acquired immunocytes functions. Past studies have discovered both positive and negative effects of regular physical activity among various types of cancer patients [7-10]. However, there were limited data on the effect of resistance exercise on patients with ovarian cancer. Ovarian cancer has a low mortality rate and can be addressed using various methods. Some reports suggest that exercise should be a part of an ovarian cancer treatment program; however, the optimal frequency, intensity, time, and type of exercise have not been specified [2]. Hence, this study explored the influence of regular resistance exercise on immunocyte function among ovarian cancer survivors. More specifically, this study aimed to provide evidence that the exercise range used in the intervention program can cause muscle hypertrophy [16] in ovarian cancer survivors based on the fact that muscle activity secretes cytokines and myokines, which increases acquired immunocytes. In this regard of muscle hypertrophy. Burd et al. [23] reported that lowload, high-volume (30% 1 RM) leg resistance exercise in healthy young adults was more effective in increasing muscle protein synthesis than high-load, low-volume (90% 1 RM). However, the hypertrophy in this value (30% 1 RM) refers to sarcoplasmic hypertrophy and does not seem to be the result of hypertrophy in the muscle proteins, that is, myosin and actin.
In the muscle stimulated by cytokines and myokines resulting from the hypertrophy process, immune cells are stimulated to offset this and eventually return to a resting state. In other words, for developing immunocytes, cytokines or myokines must be secreted, and because satellite cells are secreted to repair the damaged muscle due to microscopic damage, hypertrophy in the latter is more effective for the human body [22,24, 25]. Similar to this point of view, Strasser et al. [7] reported a significant negative impact on upper limb muscle strength with increasing intensity. That is, a low/moderate-intensity resistance exercise (under 75% 1 RM) was associated with greater improvement than moderate/high intensity resistance exercise (over 75% 1 RM). This range of 1 RM has been reported to be an amount that nearly causes hypertrophy (60%–85% 1 RM, 6–12 RM, 3–6 sets) [16].
Until now, it has not been known whether resistance exercise causes muscle hypertrophy in cancer survivors. Moreover, there is also a lack of research on changes in acquired immune cells in women who may have relatively less muscle hypertrophy. Acquired immunity is regulated by the secretion of cytokines and myokines that can suppress cancer cells in cancer survivors, so there is a strong need to identify and analyze them. According to the results of examining skeletal muscle mass, muscle strength, and muscular endurance related to muscle hypertrophy, there was were no significant differences between the CG and EG before the experiment, but there was a significant difference in strength and muscular endurance after 12 weeks. Although skeletal muscle mass did not show a significant difference between the 2 groups after 12 weeks, there was an increasing tendency in the EG, allowing us to understand the results of muscle hypertrophy reported by several previous studies to some extent [26]. Similar to these results, Rhea et al. [27] found that the maximal gain in strength development was induced by an average intensity of 80% and 60% of 1RM for trained and untrained individuals, respectively. That is, the results of this study suggest that the intensity of exercise that induces muscle hypertrophy is important to induce protein synthesis. The female cancer survivors investigated in this study showed positive results when exercising in the hypertrophy range (12 RM–6 RM).
Ovarian cancer severely affects female reproduction and hormone secretion. According to the Korean Ministry of Health and Welfare [28], there were 171 cases of mucous ovarian cancer in 2008, accounting for 9.4% of all ovarian cancer patients. Although most patients are over 50 years old, the age of occurrence varies from 25 to 71 years. Stevinson et al. [29] reported that the majority of ovarian cancer survivors expressed interest in participating in physical activity programs. Designing physical activity interventions based on these preferences can optimize adherence and outcomes in ovarian cancer survivors. Schneider et al. [30] have suggested that cancer survivors respond differently to exercise along the cancer continuum. However, once incorporated, exercise generally appears to be effective in maintaining or improving the physical and mental wellbeing of cancer survivors. Regular exercise can prevent the exacerbation of physiological toxicity occurring as a result of cancer treatments. Our findings associate resistance exercise with a decreasing tendency in bodyweight and increase in skeletal muscle mass. Although there were no significant differences in skeletal muscle mass between groups or at different time points, muscle strength and muscle endurance significantly increased in the EG. Moreover, the results of this study specify that the helper T-cell count, a marker of adaptive immunity, significantly increased in the EG, whereas the CD4/CD8 ratio in the EG decreased at week 12 compared to the baseline, indicating significant differences between groups. Accordingly, regular exercise increases the helper T-cell population while suppressing cytotoxic immune cells. In addition, this study confirmed that although the Th1/Th2 ratio of the EG increased, the CD8+ PD-1+ T-cell percentage decreased in the EG, whereas those of the CG did not change over time.
During physical exercise, CD4+ and CD8+ T cells, helper and cytotoxic T cells, and CD19+ B cells are involved in the peripheral blood, resulting in increased lymphocyte concentrations. Vigorous exercise rather than moderate exercise leads to a decrease in the concentration of lymphocytes in the bloodstream, which lowers the lymphocyte count in the tissues [31, 32]. Pedersen [13] observed that a moderate amount of exercise boosts the immune system, but strenuous exercise dampens. Regular exercise results in increased resistance to mild infections, such as the common cold, whereas strenuous exercise is associated with an increased incidence of upper respiratory tract infections [14]. CD4+ T cells activate cells of the innate immune system, such as B lymphocytes and cytotoxic T cells. CD4+ T cells are also involved in the suppression of immune reactions [33,34]. In general, B-cell function is inhibited after prolonged strenuous exercise, whereas lymphocyte concentrations increase during acute exercise and drop below pre-exercise levels after prolonged physical exercise [32]. Physical exercise induced greater and earlier increases in the catecholamines that affected the different types of lymphocytes and mobilized them in the blood [35].
After the intervention: (1) Skeletal muscle mass showed positive changes in EG compared to CG. (2) Muscle strength and endurance significantly increased in EG, while there was no significant change in CG. (3) Th1, Th2, and Th/Th2 ratio were significantly different between both groups. The significance of these results is that resistance exercise in the range causing hypertrophy can induce significant changes in helper T cells. (4) CD4+CD25+T cells (percentage and absolute value) and CD4+ PD-1+T cells (percentage and absolute value) of EG were lower than those of CG. These results can be interpreted as an improvement in the sensitivity of CD4 cells, which helps to secrete myokines and cytokines when cytotoxic substances are introduced into the human body due to the hypertrophy. (5) CD8+PD-1+T cells (percentage and absolute value) and CD8+ TIGIT+T (percentage value) of EG were lower than those of CG. These results indicate that the muscle hypertrophy caused by resistance exercise increases the cytotoxicity to human antigens and pathogens, including cancer cells.
Notes
Research Ethics
This study was approved by the Institutional Review Board of Seoul Songdo Hospital (2021-008).
Conflict of Interest
No potential conflict of interest relevant to this article was reported.
AUTHOR CONTRIBUTION STATEMENT
·Conceptualization: JKL
·Data curation: JKL
·Formal analysis: JKL
·Funding acquisition: YSJ
·Methodology: JKL
·Project administration: YSJ
·Visualization: YSJ
·Writing-original draft: YSJ
·Writing-review & editing: YSJ