


INTRODUCTION
Multiple sclerosis (MS) is an autoimmune inflammatory disease resulting in multifocal myelin degradation affecting the central nervous system producing a plethora of symptoms including voiding dysfunction. MS remains one of the most common causes of neurodegeneration in young adults, with a slight female predominance [1,2]. Up to 14% of patients’ presenting symptoms will involve urinary complaints, with close to 90% of patients experiencing some degree of neurogenic lower urinary tract dysfunction (NLUTD) during their life [3,4]. Overall, the majority of lower urinary tract symptoms related to MS are urgency and frequency found in up to 50% of patients; while a proportionally smaller number of patients (20%–25%) experience detrusor sphincter dyssynergia (DSD) [4,5].
MS is known to cause disruptions in both the storage and the voiding phase of micturition. DSD occurs when the external urethral sphincter is activated while the detrusor muscle is attempting to contract, causing functional bladder outlet obstruction and voiding dysfunction (VD) [6]. Due to the demyelinating nature of MS, signal disruption and consequently the miscoordination between the external urethral sphincter and detrusor contraction leading to DSD is very common in MS patients [4]. An important distinction must be made between DSD and dysfunctional voiding. Many MS patients may have voiding phase abnormalities that lead to VD with or without DSD. DSD must occur in the setting of a proven neurologic condition. External urethral sphincter contraction during micturition without specific neurologic pathology is considered dysfunctional voiding [7]. Nevertheless, the obstructive process caused by external urethral sphincter contraction can result in significant detriment to a patient’s quality of life, functional status, and can even result in long-term complications such as renal deterioration [8].
Even with a firm understanding of MS symptomatology and epidemiology, the presence or development of urinary symptoms does not predict disease severity, progression, or concordance with urodynamic (UDS) findings [9,10]. Dynamic imaging studies, such as positron emission tomography-computed tomography and functional magnetic resonance imaging (fMRI) modalities, have been implemented to better characterize this complex disease process [11-13]. Previously, our team found distinct functional connectivity (FC) patterns using fMRI [13] with more damage in the left anterior thalamic radiation (ATR) on diffusion tensor imaging (DTI) [14] in patients with VD compared to those without. In this study, we aim to assess the grey and white matter of female MS patients with DSD, specifically the FC of brain regions that are activated at the initiation of voiding, and the integrity of 2 white matter tracts; the ATR and the superior longitudinal fasciculus (SLF), via their fractional anisotropy (FA) and mean diffusivity (MD) values. The ATR is a reciprocal axon tract between the thalamus, the frontal lobe and cingulate gyrus. The SLF is an axon bundle interconnecting the frontal lobe, superior, and middle gyri with the ipsilateral parietal and occipital lobes. Both tracts have been found to be important in proper bladder function [15-17]. Grey and white matter footprints of women with MS and DSD were compared to cohorts of MS women without DSD, with and without VD, and healthy controls (HCs). We hypothesize that female MS patients with DSD have FC patterns that are distinct from HCs and female MS patients who do not have DSD, as demonstrated by lower FA and higher MD indicating increased damage in 2 a priori white matter tracts.
MATERIALS AND METHODS
Subjects
Adult female patients with clinically stable MS for ≥6 months and symptomatic NLUTD were referred to our neuro-urologists at our tertiary care center. Twenty-seven ambulatory female MS patients with NLUTD and 8 female HCs were recruited for this study and informed consent was obtained from all subjects. Subjects underwent 2 visits in total throughout the study: a screening visit and an fMRI/UDS visit. MS patients were divided into 2 groups: group 1, patients without DSD (n=23) and group 2, patients with DSD (n=4). Patients with prior slings (midurethral or pubovaginal), bladder/bladder neck suspensions, or previous bladder reconstruction procedures such as augmentation cystoplasty were excluded. Outpatient UDS with fluoroscopic imaging and clinical MRI images obtained from patients’ neurologists were reviewed prior to the study. Criteria for DSD required increased electromyographic activity above baseline with an involuntary detrusor contraction, and/or a dilated proximal urethra and a closed external urethral sphincter on fluoroscopic images. Criteria for VD included performing self-catheterization or having a postvoid residual (PVR) volume of ≥40% of their maximum cystometric capacity (MCC). All subjects completed a detailed history, physical examination, and validated questionnaires including the Urogenital Distress Inventory-6 [18], Incontinence Impact Question-7 [18], Hamilton Anxiety Rating Scale [19], and MRI Safety Screening Questionnaire.
fMRI and DTI Examination
The detailed protocols of the fMRI-UDS examination in our MS and Healthy Control cohorts have been reported previously [11,20]. A U.S. Food and Drug Administration (FDA)-approved, research-dedicated 3-Tesla full body MRI scanner (Philips Ingenia, Philips Healthcare, Amsterdam, Netherlands) with standard 12-channel head coil was used for the fMRI examinations.
Prior to the start of fMRI examination, subjects were asked to completely empty their bladder (spontaneously or via catheterization). Dual lumen 7Fr MRI-compatible UDS bladder and rectal catheters were placed in the patients in the scanner and the tubing was extended out to the control room to record abdominal, vesical and detrusor pressures via a Laborie UDS machine. Subjects were instructed to use hand signals to indicate time of “strong desire to void” at the time of full urgency and “voiding” when in the scanner. Anatomical, DTI, and fMRI images were obtained per our previous protocol [11,20].
During the concurrent fMRI/UDS, the bladder was gradually filled with room-temperature sterile saline at 50 mL/min until subjects signaled a “strong desire to void.” Next, subjects were instructed to hold for 30 seconds, after which they were given permission to start voiding. If subjects were unable to void, the bladder was drained passively. UDS was performed concurrently to monitor subjects’ filling and voiding cycle. After attempts to void were complete, the cycle was repeated 3 to 4 times depending on the patients’ tolerance for the procedure. Care was taken not to exceed 45 minutes for the total duration of the fMRI examination.
Data Acquisition and Statistical Analysis
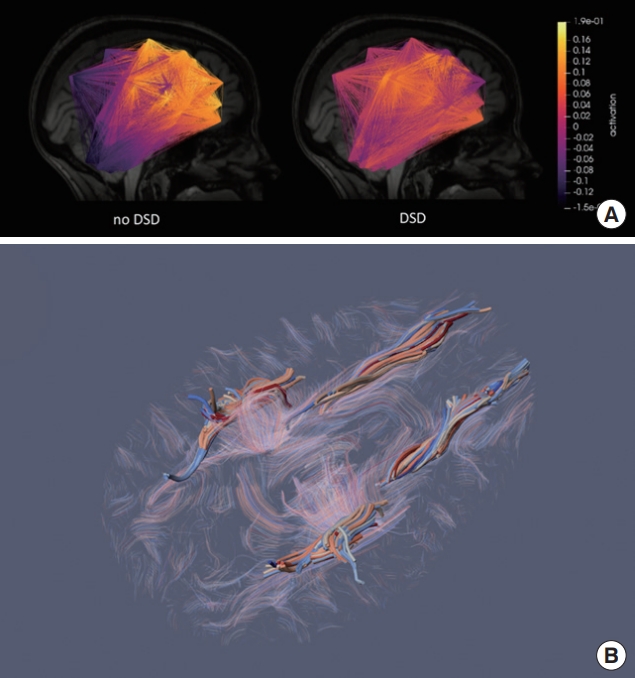
A schematic of the FC and DTI analyses is detailed in Supplementary Fig. 1. For FC (Fig. 1A), average blood-oxygen-leveldependent (BOLD) activation maps of significantly activated voxels (P <0.05) were acquired from patients’ fMRI scans. A similarity measure called FC_sim was generated from the correlation matrix of all individual BOLD activation maps to quantify the FC of each subject (Supplementary Fig. 1) [13]. Subjects with higher FC_sim values indicate more similar FC pattern compared to the FC averaged over all subjects. For DTI analysis, the 2 a priori tracts, ATR and SLF, were traced on TrackVis (Fig. 1B), and their FA and MD values were extracted (Supplementary Table 1) [17].
Shapiro-Wilk test was performed to confirm the normality of the data. Student t and chi-square test were used to compare continuous variables (lesion size, age, MS years, fMRI time) and categorical variables (presence of VD and detrusor overactivity, voiding patterns, lesion locations), respectively. Correlations between FC_sim and other continuous and categorical variables were found using Spearman and point-biserial correlation calculations, respectively.
One-way analysis of variance (ANOVA) was performed to detect significant differences in FC_sim, FA, and MD values of the 2 tracts on both sides in all 3 groups. Subsequently, Tukey post hoc test was performed to compare these values between each group, and Student t-test was used to compare subgroups of patients who had neither DSD nor VD and those with DSD, and between all MS patients and HCs.
RESULTS
Clinical data
Patient’s demographics with P-values from unpaired t-tests and chi-square tests are detailed in Table 1. There was a significant difference in age, questionnaire results, voiding patterns, use of overactive bladder medication, PVR and %PVR/MCC between MS patients and HCs.
Duration of MS and lesion burden were lower in group 2 than group 1 with no significant difference. Negative correlations were found between FC_sim and MS duration (r=-0.37, P=0.06), brainstem/pons lesions (r=-0.35, P=0.07), enhancing lesions (r=-0.43, P=0.03).
Grey Matter Analysis: Functional Connectivity
Average FC_sim value of HCs was the lowest, followed by groups 1 and 2 (Fig. 2). One-way ANOVA showed FC_sim value of HCs was significantly different compared to that of DSD and non-DSD groups (P=0.007). T-test showed a statistically significant difference between HCs and group 1 (P=0.009) and between HCs and all MS patients (P=0.011).
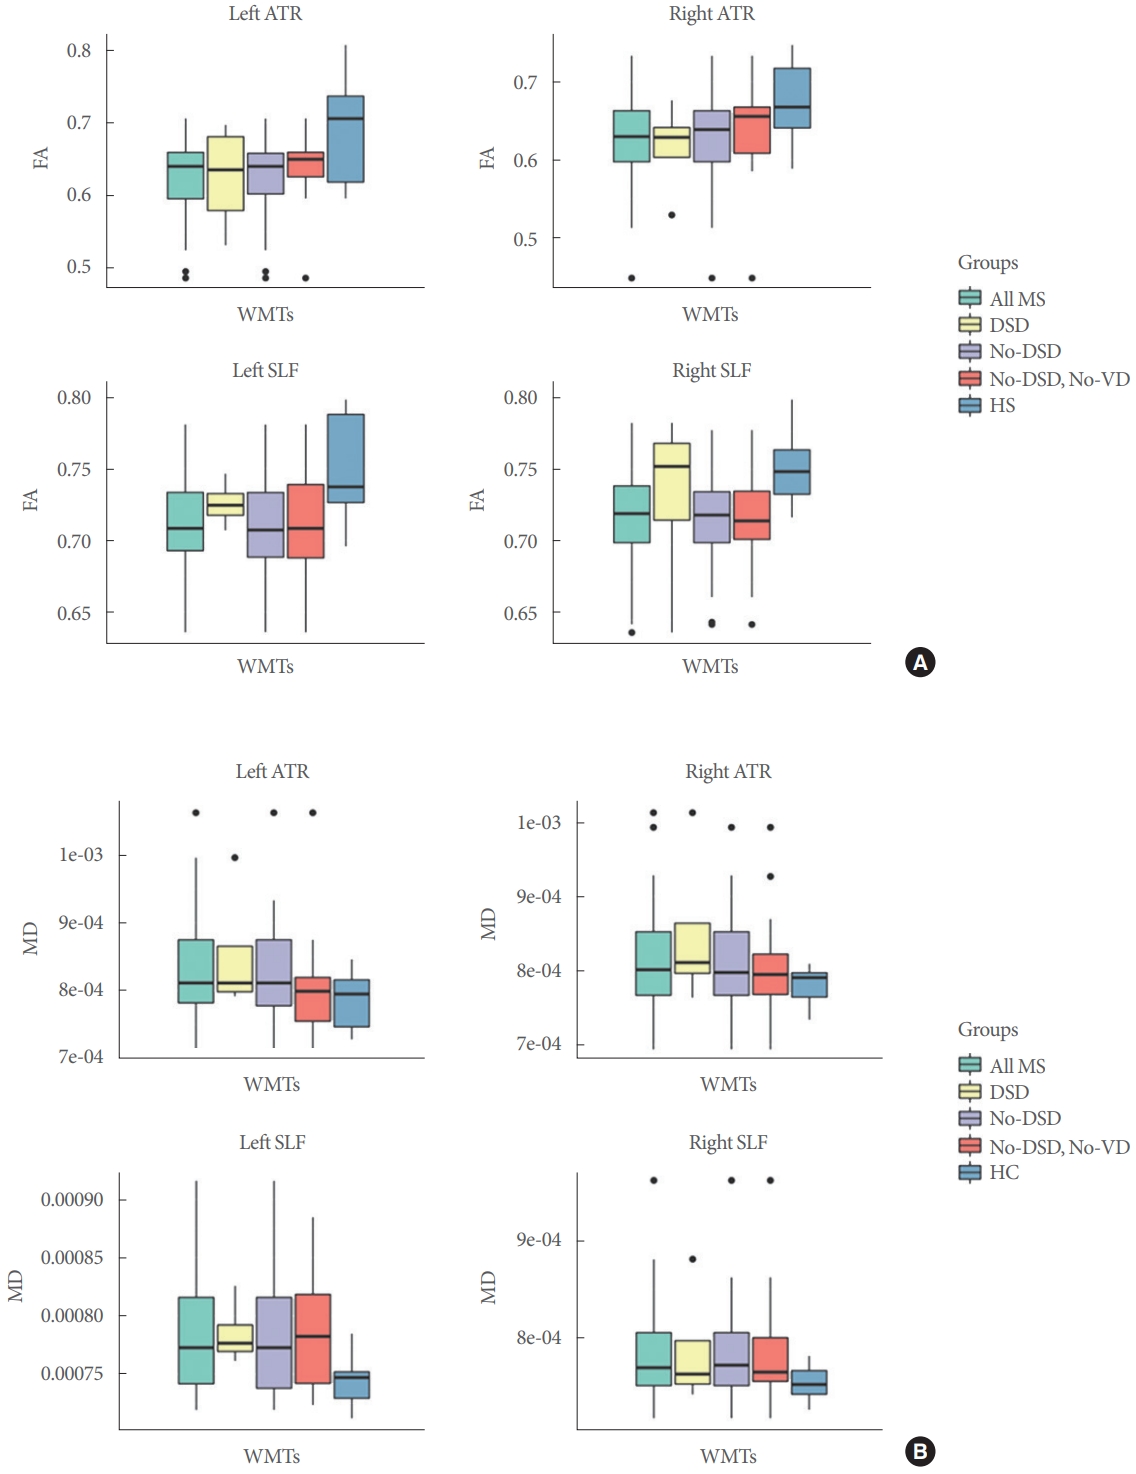
White Matter Analysis: Fractional Anisotropy and Mean Diffusivity
Overall, MS patients showed lower FA and higher MD in all tracts with statistical significance (except for the FA value of the right ATR) compared to HCs (Fig. 3). Group 2 demonstrated a trend toward lower FA and higher MD in both tracts on both sides compared to group 1 (P>0.05). Subgroup analysis with VD also showed a trend of MS patients with both DSD and VD having lower FA and higher MD in the left and right ATR compared to those with neither DSD nor VD (P>0.05).
DISCUSSION
MS lesions damage nervous system pathways critical for normal voiding function. The majority of MS patients have symptoms of urgency, frequency or urge incontinence secondary to neurogenic detrusor overactivity, with an important subset of patients having functional bladder outlet obstruction resulting from DSD. Although DSD is commonly found in neurogenic patients with spinal cord injury and MS, there is no clear relationship between the severity of the condition and the type of DSD, making it challenging to phenotype MS patients with DSD [6]. In this study, we used grey and white matter neuroimaging parameters, as well as clinical variables such as lesion burden, age, and duration of MS, in an attempt to evaluate their contribution to higher neural control in our cohort. Previous studies in DSD have focused more on the spinal cord than higher neural correlates. Oppenhiemer et al originally showed that up to 59%–80% of patients with DSD had cervical lesions, often with a strong preponderance for the reticulospinal tract, a known pathway for developing DSD with MS [21,22]. Furthermore, Araki found cervical lesions to be strongly associated with developing DSD in MS, although the type of DSD is poorly categorized [23].
Presently, our data showed no significant difference in number or location of spinal cord lesions between the 2 groups (Table 1). However, MS patients with DSD showed a trend of lower average age and shorter duration of MS than those without DSD. A study by Tsagkas’ group was able to correlate quicker progression of MS with greater number and size of spinal cord lesions [24], which could lead to quicker onset of DSD. However, it is unknown whether different lesion sizes, lesion density and locations could be indicative of the presence or absence of DSD in MS [23]. A recent 7T fMRI study of the spine showed small changes in local connectivity around MS lesions with variance depending on location along the spinal column, possibly indicating that changes to local connectivity patterns are of more clinical value than exact location along the spinal column [25].
We have previously shown a negative correlation between FC_sim and lesion size (lesions smaller than 20 mm) in women with MS and VD, suggesting larger lesion size and enhancement may correlate to VD [13]. In the present study, there is a significant difference in FC_sim between HCs and MS patients, indicating the difference in their brain FC at the initiation of voiding. HCs group demonstrated the lowest average FC_sim value among the 3 groups, indicating the least similar FC patterns due to the lack of pathology and the plasticity to generate different connectivity patterns. Increased connectivity (with higher FC_sim value) in the presence of lesions observed in MS patients could reflect a compensatory mechanism within local grey matter circuits [26-28]. FC_sim is also negatively correlated with lesions located in the brainstem and pons, where the pontine micturition center (PMC) is located. Disruption of signal transduction to and from the PMC could result in high urethral closing pressure during a detrusor contraction, causing DSD [6]. Previously, we have shown that MS patients with DSD exhibit a trend toward stronger brainstem activation in areas of executive function, emotional processing, and movement [11]. This could result from learned voiding behaviors, such as abdominal straining required to initiate voiding in the presence of bladder outlet resistance, ultimately affecting the similarity and synchronization of FC patterns in patients without DSD. This is consistent with a recent fMRI study by Seseke et al. [29] comparing the activation patterns of MS patients with DSD versus healthy individuals. They were able to elucidate differences in brain activation patterns between the 2 groups as seen in the brainstem, along with stronger activation of the L-region in the pons indicative of patients’ inability to voluntarily relax the urethral sphincter.
With regards to white matter, FA and MD were generated from subjects’ DTI scans to evaluate the integrity of the 2 white matter tracts of interest. FA is proportional to the spatial in-homogeneity of water diffusion and therefore a measure for the coherence of a white matter tract bundle. Consequently, higher FA values indicate higher signal transduction along the main white matter tract [30]. MD, on the other hand, is proportional to the free diffusion of water in the brain’s tissues’ extracellular space independent of the main direction of the tract; thus, higher MD values infer an increase in signal dispersion [31]. Therefore, lower FA and higher MD values are indicative of deficits in white matter tracts. Our results verified the compromised integrity of the white matter tracts characterized in MS by showing significantly lower FA and higher MD (P<0.05) in both the left and right ATR and SLF in all MS patients with NLUTDs compared to HCs. Within MS patients, there was no clear trend between those who have DSD and those who do not. However, subgroup analysis of patients with DSD versus those who have neither DSD nor VD revealed a trend of more damage in the ATR on both sides, though the difference was not significant (P>0.05). This finding suggests that the presence of VD might be an important variable in evaluating the damage of these tracts, which can aid the process of phenotyping DSD and monitoring MS progression in this patient population.
Despite this trend, the lack of statistical significance in both FA and MD values may be due to the low number of DSD patients. These 2 tracts were chosen a priori based on previous studies signifying their importance in proper bladder function in nonneurogenic adults with urinary incontinence [15,16]. However, this does not preclude other white matter tracts where damage from MS lesions may also play an important role in classifying DSD. Investigating other tracts will require a more robust approach allowing for more efficient evaluation of all available tracts using a white matter atlas in combination with machine learning [32]. In addition, current MRI modalities for the spinal cord, whose lesions play an important role in the presence or absence of DSD, are limited due to its smaller and mobile structure [26]. As a result, white matter integrity in the spinal cord was not assessed in this study. Future studies assessing white matter tracts in both the brain and spinal cord should be done to confirm this result.
Although the study included a large number of women with MS, it only evaluated 4 female MS patients with DSD. This prevalence closely resembles the pattern seen with DSD in MS patients in the literature (20%–25%) [4]. Given that there are multiple phenotypes and diverse methods of diagnosing DSD, the small sample size of MS patients could be a confounding factor in assessing the grey and white matter among different types of DSD. A larger and more balanced sample size would help detect the likely small functional changes due to the axonal loss or disruption of inhibitory signals [25]. The inherently unnatural setting of lying supine for fMRI and UDS is a confounding factor that may make it difficult to void for both healthy individuals and especially MS patients who already difficulties voiding. Supine positioning, UDS catheters, and supraphysiologic bladder filling might affect the activation map of different brain regions and subsequently the FC analysis, even though DTI signals in white matter in similar studies have not been found to be altered by these quick dynamic variations [33,34]. Additionally, DTI captures anatomical parameters of the brain, which are not thought to vary as much as FC does [35]. As previously mentioned, our study does not address spinal lesions and the major effects they may have on sensory and motor function. Although appropriate lower urinary tract function involves both the brain and spinal cord, the initiation of voiding originates in the brain [11]. Therefore, we focused only on brain lesions in this study. We controlled for ambulatory status, disease stability, and disability status but did not control for total lesion burden or location. Finally, although previous studies have attempted to analyze brain activation of DSD in neurogenic patients, investigation of functional and anatomical connectivity in this patient population is still minimal. The power of this preliminary study and clinical meaning of these results still need to be further analyzed and confirmed with future studies.
To our knowledge, this is the second study to examine the higher neural control in MS patients with DSD. While the study of Seseke et al. [29] focused on the activation patterns of DSD patients compared to healthy individuals, they did not include a control group of MS patients without DSD. Our study offered the advantage of analyzing the FC in MS patients with and without DSD in addition to HC, which evaluates the synchrony of activation/deactivation patterns that is often compromised in MS patients [36], a coordination important in micturition circuits. As opposed to a non-voiding pelvic floor contraction model used in the study of Seseke et al. [29], a concurrent fMRI/UDS model was utilized in our study, which allowed for a real-time and more accurate FC pattern as subjects were permitted to void during their fMRI examination.
Despite the prevalence of DSD in MS, this represents the first study to examine both the brain functional and anatomical connections in MS patients who have DSD. Our current study demonstrated distinct FC patterns between MS patients with and without DSD and HCs, showing trends of more damage to specific white matter tracts in patients with DSD compared to those with neither DSD nor VD. Future studies with larger sample sizes and more robust approaches should be done to explore the potential neuroimaging markers for identification of DSD in MS patients, which could lead to new prognostic and therapeutic interventions for NLUTD in MS patients.